Abstract
How do firms navigate the tension between securing proprietary knowledge and remaining open to knowledge flows? We study this tension in the context of economic espionage, compiling a comprehensive dataset of incidents where foreign competitors steal technology from US firms. In an event study design, revenues and R&D at targeted firms decline by 40% within five years, with mechanism analysis suggesting that this loss is driven by obsolescence of the firm’s valuable technology. These effects do not appear for firms unsuccessfully targeted for espionage, supporting a causal interpretation. However, we find no evidence that targeted firms become more restrictive on knowledge flows after espionage; firms do not reduce hiring of foreign scientists, patenting with foreign inventors, or international business functions. Overall, espionage has clear economic harms to targeted firms and US industry, but firms appear to value the benefits of inward knowledge flows more than these costs.
1 Introduction
In 2011, American Superconductor Corporation (AMSC) was struck by one of the most visible episodes of modern economic espionage. Its largest customer, the Chinese wind-turbine manufacturer Sinovel, bribed an AMSC engineer to obtain the source code for AMSC’s wind turbine control systems. After receiving the source code, Sinovel canceled its contract with AMSC. AMSC subsequently lost 80% of its market value. Yet the response to this theft of proprietary software was surprisingly passive. Faced with a decision to open up or close off to the rest of the world, AMSC executives proposed no major shifts in their business or innovation strategy, simply emphasizing the importance of continuing relationships with Chinese customers.3
AMSC’s case demonstrates a core tension underlying modern innovation: developing trade secrets and proprietary knowledge is necessary for firms to obtain a commercial advantage, highlighting the importance of secrecy to innovation. Yet, the diffusion of knowledge through patents and people is considered a key driver for innovation, and closing off to external knowledge may harm as much as it helps (Jaffe et al. 1993; Singh and Agrawal 2011). Economic espionage, or incidents in which proprietary knowledge is illicitly transferred from a domestic firm to foreign firms, provides a unique window into both sides of this tension. On one side, the damages that firms suffer from espionage reflect the value of proprietary knowledge that was stolen. On the other side, how firms change their innovation strategy after espionage reflects the value of openness and international collaboration.
The tension between proprietary knowledge and openness motivates the two questions of this paper. In the first half of this paper, we ask: how valuable are trade secrets to firms? To answer this question, we compile a comprehensive dataset of publicly disclosed espionage incidents based on prosecutions under the Economic Espionage Act since 1996 and publicly disclosed cyber intrusions. China is the beneficiary country in 80% of cases in our data. Our sample is limited to publicly disclosed cases, so we cannot speak to the average or unreported espionage incident; our estimates characterize high-profile incidents in which firm responses are most likely to reflect the tradeoff between secrecy and openness. We use an event-study framework to understand the impact of espionage on firms, comparing the trajectories of firms targeted for espionage with other untargeted firms in the same industry. We find that espionage has large negative effects on targeted firms. Being successfully targeted for espionage reduces firm revenue and R&D spending by 40% after 5 years, with effects persisting for up to a decade.
Key to our identification strategy is that we find no effect on firm outcomes when espionage attempts are unsuccessful (i.e. when no knowledge was transferred, because the attempted espionage was detected and stopped). This placebo test provides strong evidence that our estimated effects are not driven by violations of the parallel trends assumption, but rather reflect the causal impact of successful espionage on firms. Moreover, these results are robust to alternative identification strategies, and they hold for a variety of other firm outcomes including total assets and intangible assets. Thus, economic espionage is damaging to targeted firms—suggesting that the value of their proprietary knowledge is high.
To probe the mechanisms behind these effects, we examine heterogeneity in the effects of espionage across different types of incidents. We find that the revenue losses from espionage are concentrated in cases where firms claim high economic losses, and in industries where industry-wide R&D spending is relatively low. The first result suggests that espionage is most harmful when it targets technologies that firms identify as valuable, while the second result suggests that espionage is most harmful in industries where the key technologies are established (and thus spending on developing new technology is low). We also find that the damages from espionage are concentrated in industries with “lumpy” innovation, where relatively few patents make up a disproportionate share of the total value of innovation (as measured by (Kogan et al. 2017)). This suggests that espionage harms firms only in industries where technological advances are rare—which makes the obsolescence of existing technology particularly harmful. In short, espionage harms firms by making their valuable technologies obsolete, which dissipates their technological lead over competitor firms; this harm is persistent when technological leads are harder to create through new innovations.
We next investigate whether there are aggregate consequences to espionage. We map espionage incidents to international trade flows in affected industries. Over the decade after an espionage incident, we find that American exports in targeted sectors decline by 40%. These export results are more uncertain than the firm-level results, because the industry-level placebo test is less clean: Chinese exports rise even in sectors where espionage was unsuccessful, implying that the appropriate counterfactual for China involves a rising baseline. With this caveat, we find no evidence that Chinese exports rise through increased international market share, suggesting that the harms to the US are not offset by observable gains to China through this channel. Global exports in targeted sectors decline by 10%, suggesting these are net losses, not simply a US-to-China redistribution. These results demonstrate that the economic damages from espionage extend beyond individual firms to have measurable aggregate effects on US industry and global markets.
While the first half of our paper establishes the value of proprietary knowledge to targeted firms, the second half focuses on how firms respond to espionage. Firms must respond to espionage by balancing the costs of outward knowledge flows (i.e., proprietary secrets leaking) with the benefits of inward knowledge flows (i.e., acquiring new information). For example, collaborating with Chinese inventors brings knowledge into the firm that can increase profits, but also might carry a higher risk of knowledge being expropriated. The relative value of these flows is reflected in whether firms dial up protections of proprietary knowledge that also curb inward knowledge flows. Thus, we analyze whether firms become more closed to international collaboration in response to espionage.
We find no evidence that firms become less open in response to espionage, across a battery of measures. Espionage does not affect the patent-to-R&D-expenditure ratio, international patent collaborations, or international citations to targeted firms’ patents. Using OPT visa records, we show that targeted firms do not reduce their hiring of Chinese scientists after espionage. Complementing this, LinkedIn data from Revelio Labs shows that employment declines after espionage are proportionally similar for Asian and non-Asian workers overall, suggesting that firms do not screen ethnically Chinese employees as a potential vector of espionage. We do find a (marginally significant) larger employment decline among Asian scientists specifically; however, we find no decline in firm-level diversity and inclusion scores, suggesting this pattern does not reflect firm-side discrimination. We also find no evidence that targeted firms exit Chinese or other geographic markets after espionage. Pooling these measures together into an index of international openness, we are able to reject any changes in openness larger than 0.03 standard deviations in magnitude.
Of course, these are only specific ways in which firms could adapt in response to espionage, and openness to international knowledge may be a high-dimensional quality not captured perfectly by any of these measures. Thus, we analyze earnings calls transcripts to measure whether firms show any changes in corporate speech following espionage, which could reflect changes in their openness. Constructing 16,000 interpretable features from earnings call transcripts, we show that targeted firms show no differences in speech, with only two significant (stylistic) differences on over 16,000 tested features of corporate speech. In short, firms do not systematically become more open or closed to international knowledge following espionage incidents.
We conclude that inward knowledge flows are sufficiently valuable to firms that the cost of losing them is not worth the value of securing proprietary knowledge more effectively by simultaneously cutting off outward knowledge flows. Thus, AMSC’s passivity in the face of Chinese espionage can be recontextualized as a valuation of beneficial knowledge flows from China. Of course, this is not the only possible explanation: if firms do not behave optimally, then the lack of response that we observe could reflect corporate inertia, agency conflicts in corporate management, or other mechanisms that we discuss in Section 5.6.
2 Context
From Roman monks stealing the secret of silk making from China in the 6th century, to George Washington and Alexander Hamilton endorsing a program to target the British textile industry to gain “secrets of extraordinary value,” economic espionage has long been recognized as a tool of statecraft. In the 19th century, the US chemical industry grew to the technological frontier through hiring German chemists who brought trade secrets (Hounshell 1988). After World War II, the US recruited hundreds of German scientists through Operation Paperclip, recognizing their importance in the oncoming Cold War. During the height of the Cold War, East Germany kept pace with West Germany in its industrial development through espionage against West German industry (Glitz and Meyersson 2020). In short, countries catching up to the technology frontier through economic espionage has a long history.
Today, economic espionage is believed to be widespread. For example, former director of the US National Security Agency Keith B. Alexander described stolen intellectual property and industrial information as “the greatest transfer of wealth in history,” estimating American losses on the order of $250 billion per year due to intellectual property theft.4
2.0.0.1 The Economic Espionage Act
The United States’ approach to economic espionage underwent a fundamental shift with the passage of the Economic Espionage Act (EEA) in 1996. Prior to the EEA, trade secret theft was primarily addressed through civil litigation, leaving prosecutors with limited tools to combat state-sponsored economic espionage. The Act established two key criminal offenses: theft of trade secrets to benefit foreign entities (Section 1831) and domestic trade secret theft (Section 1832). Penalties under Section 1831 are particularly severe, reflecting Congress’s concern about foreign economic espionage, with individual defendants facing up to 15 years imprisonment and fines up to $5 million.
The EEA’s focus has evolved significantly over time. Its initial motivation was based on concerns about industrial espionage by France, who had made it clear that they wanted to develop a computer industry to compete with the US’s computer industry, and were suspected of using industrial espionage to aid that process (Times 1991). However, in the 2000s, the focus shifted toward China, reflecting broader changes in geopolitical tensions and technological competition. From 1997-2008, defendants of Chinese descent represented 17% of EEA prosecutions. This proportion increased dramatically to 52% during 2009-2015 (Kim 2018). This shift coincided with China’s rapid technological advancement, and increasingly explicit policies aimed at acquiring foreign technology and expertise.
2.0.0.2 US-China Rivalry and Espionage
As China has grown, it has pursued ways to gain knowledge from the US. These efforts are exemplified by the Thousand Talents Program, launched by China in 2008. The Thousand Talents Program represents one of China’s most significant efforts to acquire foreign technology and expertise. It aimed to recruit leading international scientists, researchers, and entrepreneurs to work in China, with a particular focus on those with expertise in strategic technologies and access to intellectual property at major Western institutions. By 2018, over 7,000 individuals had participated, including both Chinese nationals working abroad and foreign scientists. Although research collaboration in most forms is legitimate, the program has also been used to facilitate unauthorized technology transfer, including several incidents in our sample. The Thousand Talents Program evolved significantly after receiving heightened scrutiny. China has stopped publicizing information about participants and rebranded various components of the program.
In the context of countering the Thousand Talents Program, the US Department of Justice launched the China Initiative in 2018. The China Initiative marked an aggressive shift in US law enforcement’s approach to Chinese economic espionage. The initiative prioritized investigating and prosecuting cases involving technology theft benefiting China, with a particular focus on academic and research institutions. It was the first DOJ counterintelligence initiative to explicitly name a single country as its prosecutorial focus, and made it clear that the US was going to invest in countering China’s talent program.
The China Initiative expanded traditional counterintelligence work in several ways. It increased scrutiny of research collaborations, requiring academics to disclose Chinese funding sources and affiliations. For example, the FBI maintains a page about China’s talent plans (FBI 2020). This page proactively warns companies and academic researchers about the risk of espionage from their students and employees (emphasis added):
Talent plans can sometimes foster legitimate sharing and collaboration as part of an appropriate business arrangement or research exchange, but this is not the norm. Instead, talent plans usually involve undisclosed and illegal transfers of information, technology, or intellectual property that are one-way and detrimental to U.S. institutions. Your students and/or employees could be talent plan participants.
The China Initiative also broadened prosecution strategies, using tools like grant fraud charges and failures to disclose foreign ties rather than relying solely on evidence of direct technology theft. This enabled prosecutions even without direct evidence of unauthorized technology transfer.
By 2021, the DOJ had brought over 70 cases under the initiative, charging both Chinese nationals and American citizens, particularly those of Chinese descent. However, the China Initiative faced criticism for disproportionately targeting Asian-American scientists—88% of defendants charged with grant fraud were of Chinese heritage (Guo et al. 2021)—and for creating a chilling effect on scientific collaboration. After the high-profile dismissal of charges against MIT professor Gang Chen in January 2022 (Times 2022), the DOJ ended the initiative in February 2022, replacing it with a broader “Strategy for Countering Nation-State Threats” that retains a focus on Chinese espionage.
2.0.0.3 Vignettes of Economic Espionage
It is useful to characterize what incidents of economic espionage actually look like. An emblematic case comes from American Superconductor Corp (AMSC), an American company that produces electronic control systems for wind farms. In 2011, the company’s largest customer, Sinovel, bribed an AMSC engineer for the control systems source code. Sinovel canceled their contract with AMSC upon receipt of the code and AMSC subsequently lost over 80% of their market value (Riley and Vance 2012). The case is typical in that it involved the illegal transfer of technology and the cooperation of a company insider.
A second case concerns Orbit Irrigation, an American company that manufactures sprinkling and irrigation systems. Janice Kuang Capener was in charge of operations at an Orbit plant in China from 2003 to 2009. She provided proprietary information about Orbit’s pricing strategy to Zhejiang Hongchen Irrigation Equipment, a Chinese competitor to Orbit, which they used to undercut Orbit’s position in the market (DOJ 2015). This case demonstrates that economic espionage is not always about the theft of technology, but is sometimes about economic information or market research that can also be important to businesses.
Another example is the case of Valspar Corp, an American paint company. David Lee—a technical director at Valspar at the time—illegally downloaded trade secrets from Valspar and Huarun (a Chinese subsidiary of Valspar) to an external thumb drive, with the intention of giving these secrets to the Shanghai office of Nippon Paint (a Japanese paint company) where he had accepted a vice-president position. However, he was arrested before he could actually deliver the information to Shanghai (FBI 2010). This mechanism of espionage—an individual downloading information illegally with the benefit of financial reward and employment in China—is representative of many cases. This case also exemplifies an “unsuccessful” case of espionage—where no information was actually leaked from Valspar. This kind of case will later be important for assessing the credibility of our results.
3 Data and Descriptive Statistics
Our analysis combines three new pieces of data: a hand-compiled registry of 164 publicly disclosed economic espionage incidents since 1995, firm-level financials for 23,830 firms in affected industries, and patent, OPT, LinkedIn, and earnings-call records for the subset of victim firms we can identify. This section describes each source.
3.1 Espionage Data
Our primary data on economic espionage come from court filings, Department of Justice (DoJ) announcements, and reports from relevant think tanks. This dataset compiles all publicly documented cases brought under the Economic Espionage Act since its enactment in 1996, as well as other documented instances of foreign economic espionage against US firms since 1990. For the purposes of this study, we define economic espionage as theft of a firm’s proprietary economic information—these are most often technological trade secrets, but may also include confidential information such as business development or pricing strategies. We do not include cases of explicit forced technology transfer, such as through China’s quid pro quo policy (Holmes et al. 2015). We also omit cases where the only data stolen is customer information, such as data breaches of emails or passwords, since this kind of information is not central to a firm’s economic advantage over its competitors.5
3.1.0.1 Sample Construction
To build a comprehensive database of incidents of economic espionage against the United States, we make use of the following sources:
First, we query CourtListener, a non-profit legal research database that contains legal data from a variety of sources, including the commonly used Public Access to Court Electronic Records (PACER) data.6
Second, we search through all Department of Justice press releases about economic espionage indictments,7 alongside relevant publications such as the DOJ’s Pro IP Act Annual Reports.8
Third, we complement these primary sources with compilations of espionage cases created by other third parties. These come from a wide range of actors, specifically the Cato Institute (Nowrasteh 2021), the Center for Strategic and International Studies (Rostker et al. 2023), investigative journalists (Guo et al. 2021), legal scholars (Kim 2018) and concerned citizens (Wu 2024).
Finally, we conduct our own search of news articles, corporate press releases, and cybersecurity firm announcements.9
All of these sources are necessary to develop a comprehensive picture of economic espionage, because not all incidents are pursued or prosecuted by the US government (and so may not appear on the DOJ websites or court filings). We manually confirm whether each economic espionage incident occurred or not, and collect the following information for each incident: date espionage began, date espionage ended (if distinct), earliest date espionage was reported or announced to the public, whether the suspect successfully obtained the proprietary information, the suspect’s country, whether this was a cybersecurity incident or not, alongside the victim companies targeted, and the suspect firm (when available).10
We manually code whether an espionage incident was “successful”, meaning that the attempt to steal trade secrets was successful and the information was delivered to some beneficiary, or “unsuccessful”, meaning that the attempt was not successful. This distinction is generally unambiguous from the descriptions of cases in press releases or court documents.
3.1.0.2 Descriptive Statistics
We uncover 164 cases of attempted economic espionage in our primary sample. Of these, 126 are successful (77%, cases where the suspect successfully delivered the proprietary information to the intended target), and 129 of these are attributed to China (79%). We show a timeline of espionage incidents in Figure 1. Cases cluster in the post-2010 period, with the share of cyber incidents rising sharply after 2015.
In Table 1, we provide a list of industries (SIC codes) targeted more than once by espionage, as well the number of times these industries have been targeted. The most targeted industry is semiconductors. Frequently targeted industries, including plastics, pharmaceuticals, and aircraft manufacturing, tend to be knowledge-heavy in nature, as well as reliant on trade secrets to protect their competitive advantage. They are also more likely to have military significance; in Figure 2 we plot the share of industries that are “dual-use” (Kang 2024) by whether they are targeted by espionage or not. We find that 88% of SIC codes targeted in our data are dual-use, compared to 47% of SIC codes in general. Thus, targeted SIC codes are twice as likely to be dual-use as the average SIC code, consistent with strategic motivations for espionage.
More than three-quarters of our incidents take place in a repeatedly targeted industry. Because espionage aims to acquire the most valuable proprietary knowledge, industry leaders are a priori the natural targets. In Figure 3, we plot the rank of victim firm revenues (before espionage) relative to their industry. We find that targeted firms tend to be leaders in their industry: in over half of cases, they are one of the three largest (public) firms in their 4-digit SIC code. However, Figure 8 shows that the same pattern does not hold when examining firms relative to their 3-digit SIC code: targeted firms are spread much more evenly through the firm rank distribution in their 3-digit SIC code. Victim firms cluster at the top of the revenue distribution only at the SIC-4 level, not at SIC-3. We read this as evidence that firms compete—and are targeted—within SIC-4 product markets, and we use the SIC-4 code as our industry definition throughout.
3.1.0.3 Analysis of Suspects
While the dataset identifies victim firms comprehensively, limited information exists on the perpetrators of espionage. Only 27 cases involve suspect firms that are publicly traded. We are unable to identify a suspect firm in the majority of cases for a variety of reasons: many individuals who conduct espionage incidents intend to found their own start-up or give the information to a small enterprise for which we cannot find data. In other cases, espionage is attributed to foreign universities or government agencies (such as the Chinese Ministry of State Security), making it unclear which firms precisely benefit from espionage. As a result, even though the effect of espionage on suspect firms is an important question, our data is too noisy to answer it. Thus, our analysis of the effects of espionage on China uses international trade data from UN COMTRADE, which allows us to examine the aggregate spillover effects of economic espionage across countries.
3.1.0.4 Sample Selection
We acknowledge a major limitation of our study: we can only observe espionage in the selected set of cases that are detected and reported. This set may be very different from the typical espionage case, which may still remain undetected, or only detected by a security firm and never reported to the world. Thus, we cannot claim to offer a full accounting of the welfare costs of economic espionage, or an understanding of the average espionage case (which may be very different from what we observe).
All of our results should be interpreted in the context of this selected sample. For our research question, economic espionage incidents are best understood as a window into how firms react and change their openness to knowledge diffusion in response to economic espionage information shocks. In that regard, selecting the most high-profile and important cases is an advantage, rather than a disadvantage, because these cases are more likely to drive changes in US-China knowledge diffusion than unknown cases.11
3.2 Firm-Level Data
Out of 164 cases of economic espionage, we are able to identify a victim firm in 130 incidents. There are 142 unique firms that we identify as targeted by espionage (some incidents target more than one firm). Of these 142 firms, 108 are ever publicly listed (or are subsidiaries of listed firms), allowing us to collect detailed financial information on them. Of these public firms, 75% of cases are successful incidents, and 83% are attributed to China.
3.2.0.1 Firm Financial Data
To analyze the economic consequences of espionage, we draw on firm-level fundamentals from Compustat (for American firms) and Worldscope (for international firms), standard sources for financial and operational data on publicly traded firms. This provides us with each publicly traded firm’s revenue, R&D expenditures, total assets, intangible assets, gross margins, and net profit margins. We collect data on all firms targeted by espionage, as well as all firms sharing a SIC or SIC-3 code with these firms. This leads to a total of 23,830 firms in our main sample. We use data from 1995 to 2024 on an annual basis. We also supplement this data with Compustat’s segments data to decompose a firm’s sales across locations and industries.
For firm-level stock market returns, we rely on CRSP (for American firms) and Datastream (for international firms). We additionally make use of the standard Fama-French factors made available through WRDS to estimate normal stock returns for all firms.
3.2.0.2 Firm Innovation and Knowledge Flows
We link firm-level patent and innovation outcomes using data from the United States Patent and Trademark Office (USPTO). This database provides comprehensive information on firm-level patenting activity, including location of collaborators, and those who cite these patents. Even in our set of publicly listed firms in high-technology industries, patenting is relatively rare, with 75% of firm-years recording no patents at all. Thus, we focus our analysis of patents on the extensive margin; whether firms patent at all in a given year, and conditional on patenting, who they patent with. From patent records, we pull inventor information, to understand how firms to respond to espionage through the characteristics of inventors on their patents. In particular, we use the address of inventors to characterize where they live, to understand whether espionage leads firms to reduce patenting with inventors living in China or outside the US in general. Finally, we use patent citation information to measure whether patents by targeted firms are any less likely to cite Chinese patents, or to be cited by Chinese patents. Together, these measures give us a rich understanding of how firms endogenously change their knowledge flows with China and the rest of the world in response to espionage.
3.2.0.3 Firm Employee Data
We examine how firms respond to espionage through their employment composition from two sources: the OPT Observatory by the Institute for Progress, and data from Revelio Labs. The OPT records (Buxton-Walsh and Neufeld 2025) were obtained via FOIA request from U.S. Immigration and Customs Enforcement (ICE). It includes data on the study and work patterns of all F-1 international students and J-1 exchange visitors in the United States from 2004-2023. This data allows us to trace students’ country of origin and their subsequent employers while on OPT (Optional Practical Training) work authorization. These work authorizations may last up to three years, and are predominantly issued in STEM fields, providing a good proxy for the number of foreign scientists being hired by a firm.
The Revelio Labs dataset, derived from LinkedIn, provides granular information on a firm’s workforce composition. Unlike the data sources above, every single victim firm that we identify has a LinkedIn page, allowing us to analyze outcomes for non-public firms as well. Revelio predicts the race of each employee based on their name, classifying at the level of “Asian" rather than “Chinese."12 We primarily focus on employment of Asian versus non-Asian employees in the US.
Revelio classifies all job titles into 1500 different categories—we use these categories to identify whether an employee does scientific/R&D work in their role. We manually classify these categories based on whether they are likely to conduct research and development work (examples of scientists include “Clinical research”, “Process development engineer”, or “Scientist”).13 8.7% of all employees in our sample are classified as scientists. This data allows us to understand how firms respond to espionage through their employment of scientists, as well as to detect racial heterogeneity that could reflect China-specific concerns.
3.2.0.4 Firm Speech Data
We link firms in our dataset to instances of their corporate speech from Thomson Reuters StreetEvents. This dataset contains comprehensive data on earnings call transcripts and similar corporate speech events for public firms. A typical transcript contains pre-prepared remarks from the corporation (e.g., the CEO, CFO, and other executives) and answering questions from investment analysts who cover the company.
4 Direct Effects of Espionage
This section focuses on estimating the direct effect of economic espionage on firm revenues and innovation behaviors. This is a first step of analysis before we can explore any downstream effects of espionage. Thus, in this section we investigate the direct effects of economic espionage on targeted firms. We begin with direct effects because they are the most readily measured; firms could also respond along harder-to-measure margins that we test for in Section 5.
To estimate the causal effects of economic espionage on firm outcomes, we employ a dynamic difference-in-differences framework. This approach leverages variation in the timing of espionage incidents across firms to identify treatment effects, as well as which firms are ever targeted, while accounting for firm-specific and sectoral trends.
4.1 Baseline Specification
Our core empirical specification for understanding how espionage affects firm revenue and R&D is given by the following dynamic two-way fixed effects (TWFE) regression:
\[\begin{equation} y_{i,t} = \sum_{k = -4}^{8} \gamma_k D_{i,t+k} + \alpha_i + \alpha_{j(i),t} + \varepsilon_{i,t} \label{eq:twfe} \end{equation}\] where \(i\) denotes a firm, \(t\) a year, and \(j(i)\) the industry firm \(i\) belongs to. We interpret the timing of treatment to be when espionage started against a targeted firm. \(D_{i,t+k} = \mathbf{1}\{t - E_i = k\}\), where \(E_i\) denotes the year espionage began against firm \(i\), so that each firm-year observation is assigned to exactly one relative-time bin \(k\) (with one bin omitted for normalization). The coefficients \(\gamma_k\) trace the evolution of outcomes before and after espionage begins, allowing us to examine both the pre-trend dynamics and post-treatment effects on various firm outcomes. This specification treats untargeted firms as a valid comparison group. We test this assumption directly in the spillover analysis of Section 4.4 (Figure 11), finding no meaningful positive or negative spillovers to within-SIC-4 competitors.
An important feature of this specification compared to a standard event study is that our year fixed effects are actually industry-year fixed effects. In other words, we are comparing targeted firms to untargeted firms within the same industry. This feature is important because industries could be selected in whether they are targeted for espionage or not, based on the trends of firms in that industry. Thus, we want to control for industry-specific trajectories when determining whether espionage affects a firm.
To facilitate interpretation of our results and extend the time horizon over which we can measure effects, we interpret espionage as an absorbing treatment. That is, for any firm targeted multiple times by espionage, we use the first time it experiences an incident as the treatment date, and drop later espionage events. Standard errors are clustered at the firm level. The key identifying assumption is that in the absence of espionage, the outcomes of targeted firms would have evolved similarly to those of untargeted firms within the same industry.
We estimate effects on two main firm outcomes: revenue and R&D expenditures. We use revenue as a summary statistic for how much firms are affected by the loss of the competitive advantage they previously had from having proprietary knowledge/technology. However, the welfare effects of espionage may be especially large if they affect firm innovative activity, given that innovation has well-documented positive spillovers (Myers and Lanahan 2022; Jones and Summers 2020; Arque-Castells and Spulber 2022). As a result, we use R&D expenditures to capture this dimension of the effects of espionage.
Figure 4, Panel A, plots the dynamic treatment effects on firm revenue and R&D expenditures for firms hit by an espionage incident. We find that firm revenues decline by 40% within 5 years of espionage beginning, with effects persisting for the 8 years of our window. Espionage also appears to reduce firm R&D spending by a similar magnitude, but this effect is more gradual and noisier. These results show that firms substantially shrink (or fail to grow) as a result of economic espionage, and the decline in R&D expenditures suggests that espionage may have important consequences for a firm’s innovative capacity. We find no evidence of pre-trends in the event study.
4.2 Placebo Test: Unsuccessful Cases
In addition to the standard pre-trends test, our setting allows a unique approach to testing the validity of our identifying assumption. The key feature of our setting is that we not only observe successful espionage cases, we also observe cases of espionage that failed—i.e. no knowledge was transferred out of the targeted firm. This usually happens because the attempt to steal knowledge was detected and stopped before the theft could occur successfully. This is illustrated by the case of Valspar and David Yen Lee discussed in Section 3. There are 38 such cases in our dataset.
Under the assumption that successfully-targeted and unsuccessfully-targeted firms would have had parallel trends in the absence of espionage, the sample of unsuccessful cases actually allows us to test whether our parallel trends assumption holds in the post-period. Formally, let \(S_i = I[\text{espionage on $i$ is successful}]\). Then under the assumption that \[\begin{equation} \mathbb{E}[y_{i,t}(0) | D_{i,t} = 1, S_i = 1] = \mathbb{E}[y_{i,t}(0) | D_{i,t} = 1, S_i = 0] \label{eq:placebo} \end{equation}\] estimating Equation 1 in the set of unsuccessful cases (\(S_i = 0\)) provides a direct test of the parallel trends assumption. This set of cases is excluded from our main estimation sample. If our empirical design is valid, we expect to find no significant effects in this placebo sample (\(\gamma_k = 0\) for \(k > 0\)), as no actual knowledge theft occurred. Any significant effect detected in this placebo sample would be evidence of a violation in parallel trends. Conversely, a null effect in this placebo sample provides evidence for the parallel trends assumption—stronger support than is normally available in difference-in-difference research designs.
In Figure 4 Panel B, we plot results for the placebo test using unsuccessful cases of espionage, and find null results, also supporting a causal interpretation of our main estimate. Failed attempts to steal information do not harm the targeted firms, nor are targeted firms already on a downward trajectory.
To verify that this null effect in the placebo test is not simply noise caused by a small sample size, we estimate a triple-difference specification in Table 2 that allows us to specifically test whether the treatment effect differs between the two groups (successful firms and unsuccessful firms). We find that even with the small size of our placebo sample, we can reject that the placebo effect on revenue is the same as the effect on successful firms—providing evidence that our effects are not simply driven by pre-trends. However, R&D is a noisier outcome, and the effect we show in Figure 4 only becomes large many years after the espionage. This is why the triple difference coefficient, which includes the years just after espionage, is smaller and thus can’t be separated from the placebo.
The validity of this placebo test rests on Assumption 2: that successfully and unsuccessfully targeted firms would have had parallel trends absent espionage. We acknowledge this assumption is not trivially satisfied—in principle, firms with weaker internal security may be both more likely to have espionage succeed and more likely to decline for unrelated reasons. Nonetheless, this assumption is substantially weaker than the standard parallel trends assumption required for a simple difference-in-differences design, which requires every non-targeted firm to be a valid counterfactual for every targeted firm. Here, we only require comparability between two subgroups that are both targeted for espionage—with the only distinction being whether the attempt succeeded or failed, a determination that often hinges on idiosyncratic factors such as whether an employee was caught before transmitting stolen information. To further validate this assumption, we compare pre-espionage observables between successfully and unsuccessfully targeted firms. We present a balance table in Table 3, finding no statistically significant differences along any characteristic between firms successfully and unsuccessfully targeted by espionage. This triple-difference specification can be interpreted as a formal mediation analysis (Kwon and Roth 2024), with the success of the espionage attempt as the mediator—the coefficient on the post \(\times\) successful interaction isolates the causal effect mediated by actual knowledge transfer.
4.3 Mechanisms
To understand the mechanism by which espionage affects firms, we estimate heterogeneous effects of espionage on firms and plot the results in Figure 5.
First, we separate cases based on whether the damages claimed by the victim firm in court are above or below the median claimed damages, and estimate Equation 1 separately for these two groups. Panels A.1 and A.2 show that our estimated revenue effects are concentrated entirely in cases with above-median claimed damages. Claimed damages are a legal construct that firms calculate based on the self-assessed market view of their stolen technology. Thus, cases with high claimed damages are cases where the stolen technology was especially critical to the firm’s competitive edge, and espionage may represent the loss of this competitive edge.
Second, we separate cases based on whether the targeted industry’s baseline R&D spending is above or below the median for targeted industries. Panel B.1 shows that the revenue damages from espionage are most pronounced in industries with below-median R&D spending. Although potentially counterintuitive, our preferred interpretation is that espionage is most damaging when a firm is in an industry with relatively few key technologies, compared to in a more fast-moving sector where technologies become obsolete quickly and/or the marginal value of each technology is lower.14
Third, we separate cases based on how concentrated patent values are in the targeted industry (as measured by HHI), based on returns to patenting from stock market reactions (Kogan et al. 2017). Panel C.1 shows that the revenue effects of espionage are much larger in high-HHI industries than low-HHI industries, with most of the separation coming four years after espionage. Panel C.2 shows that R&D responses are also typically larger in high-HHI industries, but this is a much noisier measure and we are unable to statistically reject the null of an equal response. This heterogeneity suggests that espionage is most harmful when there are a few key valuable technologies at stake, as it may be difficult to innovate a suitable replacement for it. On the other hand, the null result for low HHI industries (especially after four years) suggests that even if the loss of a technology to a competitor may hurt in the short-run, the relative ease of innovating a substitute may mute the impact of espionage once the product has time to come to market.
Together, these heterogeneity analyses paint a picture whereby espionage makes a firm’s valuable technology obsolete. Thus, espionage is less harmful when these technologies are less valuable or when the industry’s high rate of R&D spending means the natural obsolescence rate of technology is higher.
4.4 Robustness Checks and Additional Analyses
We briefly report additional robustness checks, which are described in more detail in 8. First, while our main specification is a dynamic two-way fixed effects estimator, we show that our results are robust to a variety of alternative event-study estimators (Figure 9). Second, in addition to firm revenue and R&D expenditures, we show that espionage also reduces a firm’s total assets and intangible assets (Figure 10), and that both domestic sales and exports to China decline (Figure 12). Third, we relax the assumption that firms in the targeted industry are untreated, allowing for spillovers to those firms (Figure 11), and find no evidence of meaningful positive or negative spillovers to competitor firms within the same SIC-4 code. Fourth, we look at how firms’ stock returns are affected by both the onset and announcement of espionage, finding that both events lead to persistent declines in returns, consistent with losses from both real factors and the market’s perception of these incidents (Figure 13). Finally, we show that results are unlikely to be driven by mean-reversion of leader firms (Figure 14) or by selection of targeted industries (Table 4).
4.5 Aggregate Effects: Exports
From a policy standpoint, what matters more than effects on targeted firms is the aggregate effect of espionage. If targeted firms lose revenue and conduct less R&D, but non-targeted firms gain revenue and conduct more R&D, the net result could be zero, simply reflecting a reallocation between firms. Policymakers would be much less concerned about espionage in that case, especially if the reallocation happened within a country. In our prior analyses, the SIC-4 industry-year fixed effects in Equation 1 absorb within-industry reallocation, so the firm-level estimates presented already net out substitution between victim and competitor firms in the same SIC-4. The export analysis tests whether further reallocation exists at the country level.
To understand these aggregate effects, we test how espionage incidents affect exports in both the US and China. We use trade data to capture industry-level effects for three reasons. First, it covers all firms operating in each country, including non-publicly listed firms that would not appear in Compustat. Second, in Ricardian models of trade, exports reveal a country’s productivity in a sector, so changes in exports can be interpreted as the best proxy for changes in industry productivity (Costinot et al. 2012). Finally and most importantly, exports are the cleanest way by which we are able to estimate how espionage affects China. For the rest of the analysis, we cannot reliably link incidents to suspect firms, and even if we could, the benefits of espionage could be diffused across Chinese industry. Therefore, looking at how Chinese exports evolve in targeted sectors is key to understanding the other side of the equation.15
We map SIC codes to HS6 codes using the 2018 revision of the concordance from (Pierce and Schott 2012), and define treatment at the industry level as the first period in which an industry is ever targeted by an espionage incident. In other words, we keep only the first time any firm in the industry was targeted. This definition relies on publicly detected espionage; if detection is selective across industries, some nominally never-treated industries may have been targeted without public disclosure, which would bias our estimates toward null results. In this specification, our never-treated HS6 codes are “nearby” codes—those that share an HS4 code with a targeted HS6 code, but are never themselves targeted for espionage. Our baseline specification is, for the outcome log(exports by country \(i\) in sector \(s\) at year \(t\)):
\[\begin{equation} y_{i,s,t} = \sum_{k=-4}^{8} \left(\gamma_k D_{s,t+k} + \beta_k D_{s,t+k} \mathbb{I}[i \text{ is US}] + \delta_k D_{s,t+k} \mathbb{I}[i \text{ is CN}]\right) + \alpha_{i,s} + \alpha_{i,t} + \epsilon_{i,s,t} \label{eq:trade_ddd} \end{equation}\]
Regressions are at the exporter-HS6-year level, and include exporter-HS6 and exporter-year fixed effects.16 Apart from the direct treatment effect, we also conduct triple differences, interacting time to treatment with the exporter being the US or China. For interpretation of coefficients, in this section, we restrict cases to only the 129 where the suspect country is China.
We plot results in Panel A of Figure 6. We find that ten years after espionage occurs in a sector, exports by the US fall by 40%. Puzzlingly, exports from China also fall in the short term before recovering in the long term, suggesting that China does not appear to gain through international markets in a way that offsets US losses.
These effects are surprisingly large. Are they due to selection of which industries are targeted for espionage? We test this with the same placebo test as before: under Assumption 2, we can test whether these effects are due to espionage by estimating Equation 3 in the sample of unsuccessful cases. Panel B of Figure 6 reports the result of this placebo test. Here, the placebo test is not as clean as before. We see no decline in exports from the US or the rest of the world, suggesting that the effects on the US and the rest of the world from Figure 6 are truly causal. However, we do see Chinese exports rising in sectors even when espionage is unsuccessful. This implies that the appropriate counterfactual for China is a rising baseline, meaning the true negative causal effect of espionage on Chinese exports is likely larger than our raw estimate—our detected effects on China are therefore if anything understated.17 The clean US and rest-of-world placebos support a causal interpretation of the export declines for those exporters.
We note two additional reasons that effects may be large. First, many targeted firms are large, multiproduct firms, and so losses in affected HS6 codes may be larger than the average losses the firm faces. Second, on a ten year horizon, the loss in revenue for targeted firms is similar in magnitude to the decline in exports. Given the size distribution of firms follows a power law (Axtell 2001) and that many sectors are repeatedly targeted, this can reconcile the large estimated effects on exports.
5 Firm Responses to Espionage
The previous section has established the direct effect of espionage on firm and industry outcomes. Having documented these substantial harms, we turn to a natural follow-up question: how do targeted firms manage their innovation in response to espionage? We study firm responses across four margins: patenting behavior, employment of foreign scientists, participation in international markets, and corporate speech. Restrictions along any of these dimensions could compound the direct economic damages from espionage by reducing the knowledge flows that sustain long-run innovation.
5.1 Patent-Based Openness
One way to understand firm openness and knowledge-sharing with the world is through patenting behavior. Patenting inherently involves disclosure of inventions, providing knowledge spillovers to the rest of the world. Patenting data additionally includes information about how the technology was produced (e.g., the location of collaborators) that indicate how internally open the firm is. Thus, we can get a richer understanding of how espionage affects knowledge diffusion by measuring patenting outcomes.
We estimate Equation 1 with patent-based outcome measures, with two modifications. First, because we are especially interested in how firms respond to geopolitically sensitive incidents and US-China competition, we restrict our focus to the cases where China is the beneficiary of espionage. Second, we define “treatment” as when espionage against a firm ends, rather than when it begins. Previously, the relevant event was when a firm had its knowledge stolen. Here, we are interested in firms’ endogenous responses to espionage, which requires that the firm be aware it has been targeted. The date of espionage ending is our best proxy for when a firm discovers that it has been targeted for espionage.
As Figure 1 shows, there is substantial variation in how long espionage lasts. Sometimes there are years between when a company is first compromised and when espionage ends, other times the espionage is a one-time event and so there is no distinction. The date of espionage ending is our best proxy for when a firm discovers that it has been targeted for espionage.
A natural concern with adapting Equation 1 is that now our treatment is an information shock, not a technology shock—and untargeted firms can respond to this information shock. Put differently; Airbus cannot (directly) lose revenue because Boeing was targeted for espionage, but Airbus can restrict its knowledge sharing in response to Boeing being targeted for espionage. In 8.2, we show that competitor firms in the same targeted SIC-4 do not change their innovation management in response to espionage against their competitors, which supports treating them as a valid comparison group for estimating the effect of espionage on targeted firms.
We first estimate the effect of espionage on the propensity for firms to patent. In Figure 19, Panel A, we show that firms targeted by espionage are about 20-30% less likely to patent in the 5-10 years following an espionage incident. This decline in innovation is consistent with the overall declines in firm size, spending on R&D, and number of scientists employed that we document above, and may represent a substantial loss of knowledge given the frontier research that these firms tend to engage in.
However, it is important to distinguish between a reduction in patenting because of scale effects (less revenue and liquidity to fund R&D), and a reduction in patenting because firms are being more secretive about the technologies they are developing. Only the latter contributes to a reduction in knowledge openness. We proxy for this measure of “secrecy” by measuring patents filed per dollar of R&D expenditure—reflecting the fact that if the results of R&D were instead held as trade secrets, that would decrease the patents filed per R&D dollar. In Figure 7, Panel A, we estimate how espionage affects the patent-to-R&D ratio. The results show that if anything, espionage increases the patent-R&D ratio. For firms to have become more secretive, they would have had to become much more efficient in converting R&D spending into real innovation, which is unlikely given the other measures of firm decline. Thus, we do not see firms becoming less likely to share knowledge through patenting after being targeted for espionage.18
Consistent with this null result, we find no evidence of firms restricting their international collaborations across other dimensions. In Figure 7, Panel B, we show that firms are no less likely to patent with inventors living in China, indicating that firms may not adjust their international scientific collaboration practices in response to espionage. The innovation literature also uses patent citations as an indicator of knowledge diffusion. In Figure 7, Panel C, we find that Chinese firms are no less likely to cite patents from the targeted firm in response to espionage. In Figure 19, we examine two other outcomes of interest. Firms are no less likely to patent with inventors living outside the US, and citations to the targeted firm’s patents also do not change in response to espionage. This indicates that targeted firms do not seem to restrict other firms’ awareness of their technologies.
Collectively, these results indicate that targeted firms do not deliberately make their patented technologies less open to China or the rest of the world. This implies that firms view the benefits they get from patenting and having an international set of collaborators as sufficiently large to offset any costs associated with espionage.
5.2 Employment Responses
The key vector for espionage is employees of the targeted firm. Thus, an important margin of response for targeted firms is how they adjust their employment decisions. In particular, we ask: do firms become more discriminatory towards employees who they perceive as “high espionage risk”? In espionage cases involving China, the most likely category that firms would want to restrict is Chinese scientists—especially those doing deep technical work that they could take to Chinese firms. This kind of employment discrimination would be illegal, but is certainly a plausible response by firms.
5.2.0.1 OPT Hiring
The US immigration system offers work authorization for student F-1 visas, known as OPT (Optional Practical Training). In STEM fields, these may last up to three years (whereas they last only one year outside STEM). As such, the number of OPT employees at a firm is a good proxy for the number of new foreign scientists that it is hiring.
We link firms in our dataset to OPT records provided by Buxton-Walsh and Neufeld (2025), obtained via FOIA request from U.S. Immigration and Customs Enforcement (ICE). We identify Chinese OPT employees by those with either their country of birth or their country of citizenship being China, including Hong Kong. We restrict our focus to individuals with masters/doctoral degrees who have studied a subject on the list of CIP codes that the Department of Homeland Security classifies as STEM. This is the group of employees that could represent the greatest potential vector for espionage—highly technical talent whose visa status in the US is not certain. As such, if firms respond to espionage by screening out employees with high perceived “espionage risk”, we would expect to see reductions in the hiring of Chinese STEM OPT workers.
In Figure 7, Panel D, we estimate how employment of Chinese OPT workers per million dollars of firm revenue changes following the revelation that espionage has occurred. We normalize by firm revenues to avoid a mechanical effect, whereby firms hire fewer workers overall due to lower revenues and thus also hire fewer Chinese OPT workers. The outcome is standardized to have mean 0 and a standard deviation of 1. We estimate a tight null, able to generally rule out effects larger than 0.03 standard deviations in either direction. In Figure 15, we show that this result is not sensitive to alternative definitions of Chinese OPT workers (including all degrees, all majors, or restricting to mainland China). Together, these results suggest that firms do not respond to espionage by reducing their hiring of Chinese scientists.
5.2.0.2 LinkedIn Employment
While Chinese OPT workers are plausibly the group most likely to be affected by hiring restrictions following espionage, they are only one group of workers. To gain a broader picture of how firms change their hiring practices following espionage, we use LinkedIn data provided by Revelio Labs. This data captures the stock of all employees at targeted firms, and allows us to examine whether broader employment patterns reflect discriminatory adjustment. Revelio classifies employees into ethnic categories based on their name, allowing us to observe the number of ethnically Asian employees at each firm over time.19 Revelio also classifies job titles into 1500 employment categories, which we manually classify as “scientist” and “non-scientist” jobs to determine whether a job involves R&D work (e.g. “process development engineer”, “research scientist”). This measure is more coarse than the OPT results that make up our primary analysis, but it is more representative, so we see it as a useful complement.
Figure 20, Panel A, shows that while firms see 40% lower employment after espionage incidents (consistent with the overall decline in firm revenue), this decline is uniform for Asian and non-Asian employees. One discordance comes from focusing on scientists—in Panel B, the number of non-Asian scientists falls by 30% five years after an espionage incident, but the number of Asian scientists falls by 50%, with a marginally statistically significant difference (p=0.068).
Unlike our OPT results, this pattern could suggest that firms are screening out ethnically Asian scientists in response to espionage concerns. However, it is also consistent with ethnically Asian scientists having better outside options, that lead them to leave the targeted firm at higher rates—recall that firm revenues and R&D spending fall after espionage, so employees could have good reasons to leave.
To distinguish between these two explanations, we estimate the effect of espionage on perceived diversity and inclusion within targeted companies. Revelio records the text of employee reviews of each firm and for many reviews, also provides the employee’s DEI rating of their firm. We use machine learning methods on the text data to estimate DEI scores on the full sample of reviews. Details on how this data is constructed can be found in 7.2. If being targeted for espionage led firms to discriminate against Asian scientists, we might expect to see lower DEI scores based on reviews from scientists, especially compared to non-scientists for whom we do not see this differential selection pattern.
Figure 17 shows that after espionage, there is no decline in the DEI scores of that firm, either by scientists or by non-scientists. Thus, we conclude that the differential decline in the employment of Asian scientists is likely due to those scientists having stronger outside options (and/or greater anticipation of firm difficulties), rather than due to discrimination.20 Our LinkedIn results thus line up with the OPT results, in showing that firms do not respond to espionage by changing their willingness to hire Chinese scientists. Put together, these imply that the value of international talent is sufficiently high that they (more than) offset the costs of espionage.
5.3 Geographic Markets
We use segment data from Compustat that describes the geographical markets in which a firm operates, and their sales in each market.21 Firms may respond to espionage by reducing their global exposure, focusing efforts on certain markets or excluding other markets; they may also expand their coverage in an attempt to diversify.
In Figure 7 Panel E, we find no evidence that firms contract their geographical footprint in response to espionage; the number of markets that firms operate in does not fall after espionage. We also directly examine whether firms change whether they operate in China, the country most associated with espionage in our sample. If firms respond to Chinese espionage by pulling back from China as a market, we would expect a decline in the probability of having a Chinese business segment. In Figure 22, Panel A, we find no evidence that firms exit the Chinese market in response to espionage targeting. One may also think that discrete changes in geographic markets are too large of a response to detect: firms may reallocate operations across geographic markets, while maintaining all preexisting global ties. We examine whether these intensive margin allocative effects occur by testing whether the HHI of sales across geographic segments changes after espionage. In Figure 22, Panel B, we find no systematic evidence of this occurring. This indicates that firms are not strategically responding to espionage incidents by altering their geographic business strategy.
Firms may also respond to espionage across their business operations. We next examine whether firms change their operations across business segments (major product lines or divisions within the company).22 In Figure 22, Panel C, we track the number of business segments a firm operates in. A firm may strategically narrow its product lines in response to espionage, either to focus resources or to reduce the surface area of potential theft. We find no significant change in business scope by this measure. In Panel D, we test for intensive margin changes by looking at the HHI of sales across business segments. We also find no evidence of changes in their business strategy along this margin. In short, across both geographical markets and strategic business segments, we find no evidence of firms adapting to espionage.
5.4 Earnings Calls
We do not find that firms respond to espionage by adjusting their patenting activity, employment, or geographical coverage. However, the space of possible actions that a firm could take in response to espionage is immense—it would not be possible to directly test for them all. To get as comprehensive of a view as possible, we instead test for changes in the nature of corporate speech.
We test for changes across the high-dimensional space of corporate speech using the method of Carlson (2026), which uses LLM representations of concepts to summarize text data and test for differences in any concept contained in the text. This method allows us to (in principle) pick up on any dimension of a response to espionage represented in public speeches by corporate executives and the analysts questioning them.23 This method is designed to be automated, minimizing researcher degrees of freedom, while allowing for a very large number of hypotheses to be tested with appropriate multiple hypothesis correction. More details on the method can be found in 7.3.
Figure 23 shows the results of this analysis. Of 16,000 tested hypotheses for differences in corporate speech between successfully targeted and unsuccessfully targeted firms, we find that only two differences are statistically significant. Both of these represent stylistic differences in speech and are not economically meaningful (“patterns of formatting changes or markup language” and “the word ‘while’ in various contexts”). Thus, earnings call data provides a rich null result, ruling out effects on a wide range of firm responses that would be reflected in earnings call transcripts.
This null result is corroborated by our own qualitative reading of earnings calls by these firms; when we read earnings call transcripts in the aftermath of espionage, neither firm representatives nor analysts questioning them tend to discuss the news of espionage and how it affects the firm, even after the espionage has become public knowledge. One prominent exception is the case of AMSC (introduced in Section 2). When discussing how they would adapt to the espionage incident, executives noted:
The actions of Sinovel are not a referendum on China wind or China in general. We have, and will continue to have, many valued relationships in China. We remain strongly committed to Chinese wind customers, like Dongfang, XJ Group, Shenyang Blower Works and JCNE. It is an economic reality that we must do business in China and I believe we can do it securely and profitably.
In 7.3, we excerpt more of the transcripts, noting a general throughline of a failure to systematically adapt to the espionage incident.
5.5 Aggregate Firm Openness Index
One possible concern with interpreting our null results is that given our small sample size, a null result could reflect either a true null effect or simply a lack of power in our sample. To address this concern, we aggregate the outcomes tested in the sections above into an index of “firm openness”, and test for effects on this index. We define a firm openness index by standardizing each of the five outcomes captures in Panels A-E of Figure 7. We then define the firm openness index as the inverse-covariance-weighted average of these standardized outcomes (Anderson 2008).
Panel F in Figure 7 shows the results of this analysis. Interpreting the index as a measure of firm openness, we can rule out espionage decreasing firm openness by more than 0.04 SDs in the eight years after espionage ends. This null is much more precise than its constituent outcomes, and provides clearer evidence that our results reflect true non-responsiveness by firms to espionage, rather than limitations of our data.
Another concern is that firms may not realize that they have been targeted for espionage until years after an espionage incident ends, mechanically biasing our early year coefficients towards 0. To address this, we replicate Figure 7 using the year a firm announces an espionage incident as the timing of treatment instead. This guarantees that firms are aware of the incident. We plot results in Figure 16. We continue to find a sharp null under this alternate specification.
5.6 Discussion
The preceding analysis establishes that across a variety of outcomes—patenting, employment of Chinese scientists, geographical market presence, and corporate speech—firms do not respond to espionage by becoming less open or more restrictive in their innovation management. Given the large economic damages we document, this is a striking and perhaps puzzling result.
Our preferred explanation for this finding is that firms navigate a difficult tradeoff when deciding on their openness to international knowledge flows. Most levers for international openness—e.g., collaboration with foreign scientists, opening branches abroad—simultaneously bring in new information to firms, while also creating risks of proprietary knowledge flowing outwards. We find that firms decide not to reduce their international openness even after a large shock to their stock of proprietary knowledge. This suggests that, on average, the benefits of inward knowledge flows are substantial enough to offset the risks of knowledge outflows.
There are alternative explanations compatible with this finding. One possibility for the non-response of firms could be that espionage does not constitute a genuine information shock. If firms already know that their industry is frequently targeted for espionage, the discovery that they themselves have been targeted need not trigger any response if their security decisions were already optimal. We investigate this possibility in 8.2, focusing on the first time a sector is targeted by a public espionage incident. We find no clear evidence of differential adjustment in these cases, either. We note that even if firms were fully informed about the costs and risks of espionage ex ante, the realization of espionage is still an unexpected negative shock. This makes a response from firms via international openness plausible. As an analogy, firms may understand both the costs and probability of tariffs being imposed; yet when a new tariff is announced, this new information is a shock that redirects international trade flows. Similarly, the timing of when espionage occurs is unlikely to be known by firms, making a response along international openness theoretically possible.
Another possibility is that the margins we study (patenting, international collaboration, hiring of foreign scientists, international business operations) are simply not important margins for firms to adjust on. It could be that firms see these margins as low-risk vectors for espionage. This is unlikely, given that a large literature documents knowledge flows through patenting, scientific collaborations and business operations as being central to innovation, as well as our examination of corporate speech, which may capture many other margins of adjustment.
An alternative explanation is that some firms become much more open and others much more closed following espionage, due to idiosyncratic conditions, in such a manner that the net effect is zero. Such heterogenous treatment effects should produce a noisily measured null, whereas ours is relatively precise. Such large variation in firm responses is also inconsistent with our reading of the transcripts around these events.
We note several other mechanisms that could explain why firms may not become less open following espionage. First, firms may deliberately minimize public acknowledgment of espionage to limit damage to shareholder confidence; in this view, the absence of any strategic response is itself strategic, aimed at projecting stability. Second, principal-agent problems within firms may prevent adjustment: the managers closest to the affected projects may have strong incentives to downplay the threat rather than flag a failure that could affect their own careers, making it organizationally difficult for firms to mount a coherent response. Third, firms may simply hold an overoptimistic belief in the durability of their technological lead—believing that even if a competitor has stolen their technology, their own accumulated capabilities and ongoing investment will prevent them from being overtaken. Each of these mechanisms features an additional friction or behavorial explanation (e.g., myopic shareholders) that our preferred interpretation does not require.24 Although we cannot rule these types of mechanisms out, they are also not mutually exclusive with firms valuing knowledge inflows enough to offset the costs of knowledge outflows.
Finally, whatever the underlying mechanism is, the reduced form finding that firms do not become more closed following espionage incidents suggests that even following (geopolitically) adverse shocks, we may not see strong decoupling in international knowledge flows.
6 Conclusion
This paper provides systematic evidence on the tradeoff between securing proprietary knowledge and benefiting from international knowledge flows, using the setting of economic espionage. We show that economic espionage has substantial negative effects on targeted firms, with revenues and R&D expenditures declining by roughly 40% within five years, with effects persisting for up to a decade. These damages are concentrated in cases where firms claim high economic losses, in industries with lower R&D intensity, and in industries with concentrated patent values, suggesting that espionage is most harmful when it targets key technologies that are difficult to replace. Importantly, we find no effects when espionage attempts are unsuccessful, providing strong evidence for a causal interpretation of our results. These firm-level effects translate into measurable aggregate effects on US industry. American exports in targeted sectors decline by roughly 40% over a decade, with no discernible gain Chinese exports in these sectors, suggesting that the damages to the US are not offset by observable gains to China through this channel.
While the damages from espionage establish the value of proprietary information to firms, the way firms respond to espionage reflects their valuation of open knowledge flows. Across a wide range of outcomes, we find no evidence of such responses. Targeted firms do not reduce their patent-to-R&D ratio, do not become less likely to patent with inventors in China or outside the US, and do not see reduced citations to their patents. We also find no evidence of changes in their hiring and retention of Chinese OPT workers or changes in the geography of their business. Firms also do not systematically discuss adaptation measures in corporate speech.
These findings have important implications. First, from a policy perspective, our results establish that economic espionage causes substantial economic harm to US firms and industries, validating policy concerns about espionage. The aggregate effects on exports demonstrate that these damages affect broader US competitiveness in targeted sectors, as well as negative spillover effects abroad. Nevertheless, the reluctance of firms to close down to international knowledge flows suggests that—despite the salient risks of proprietary knowledge leaking outwards—firms value inward flows sufficiently that they do not meaningfully change their international openness following espionage incidents.
Second, our results provide evidence on the effects of competition on innovation. Economic espionage represents an exogenous shock to competitive pressure faced by industry leaders. Our findings provide direct empirical evidence on the connection between knowledge flows and business dynamism, while the finding that firms reduces R&D spending provides support for the Schumpeterian channel whereby increased competition reduces innovation incentives.
Third, despite these substantial damages, we find no evidence that firms respond by restricting knowledge sharing in ways that could create additional spillover harms to innovation and growth. This suggests that concerns about geopolitical tensions leading to widespread restrictions on knowledge diffusion may be overstated, at least in the private sector response to espionage incidents. The fact that firms do not reduce patenting or international collaboration in response to espionage is particularly notable given the magnitude of the damages we document.
Several important questions remain for future research. First, while we have compiled the most comprehensive dataset on economic espionage that we are aware of, our dataset represents only the tip of the iceberg when it comes to economic espionage. We cannot make claims about the welfare effects of espionage using the heavily selected sample we observe. Future research could use confidential data from security firms or governments to gain a more representative picture of economic espionage events, and thus be able to make more confident claims about the typical espionage case than we can in our setting.
Second, much knowledge diffusion, both licit and illicit, happens through the movement of workers. Future research could examine the movement of workers between American and Chinese companies to understand the knowledge diffusion embodied in these moves. While our paper is about the harms from economic espionage, it is not a precise accounting of the costs and benefits associated with the movement of knowledge workers across countries, and such movement can be tremendously beneficial for knowledge production in both countries.
Finally, a caveat is in order for interpreting our results. In examining the economic impacts of espionage, we are aware of the political and racial undertones of discussions about Chinese economic espionage. It is important to highlight that most corporate espionage cases do not involve a foreign country at all, but instead come from domestic competitors (Fang and Li 2021). In our dataset and analysis, we focus on foreign economic espionage and Chinese economic espionage in particular, because Chinese economic espionage is an active policy issue of large importance. But there is a fine line between countering Chinese espionage and persecuting ethnically Chinese researchers. As Kim (2018) and Fang and Li (2021) show, Economic Espionage Act prosecutions are systematically biased against ethnically Chinese defendants. Our findings should not be taken as a justification to lower the standards of evidence for alleging economic espionage in particular cases.
Acknowledgments
We are grateful to Jesse Shapiro, David Yang, Andres Rodriguez-Clare, Ben Faber, Pete Klenow, Chad Jones, Carolyn Stein, Kirill Borusyak, Matilde Bombardini, Elhanan Helpman, Pol Antras, Fred Heiding, John Sturm Becko, Matthew Lee Chen, audiences at the Berkeley Trade Lunch and the Harvard Political Economy Lunch, and especially Daniel Gross for invaluable feedback. We are also grateful to Jeremy Wu, Alex Nowrasteh, MIT Technology Review and the Center for Strategic and International Studies for their work in compiling cases of espionage, without which this study would not be possible. Both authors acknowledge support from the NSF Graduate Research Fellowship.
References
Figures and Tables
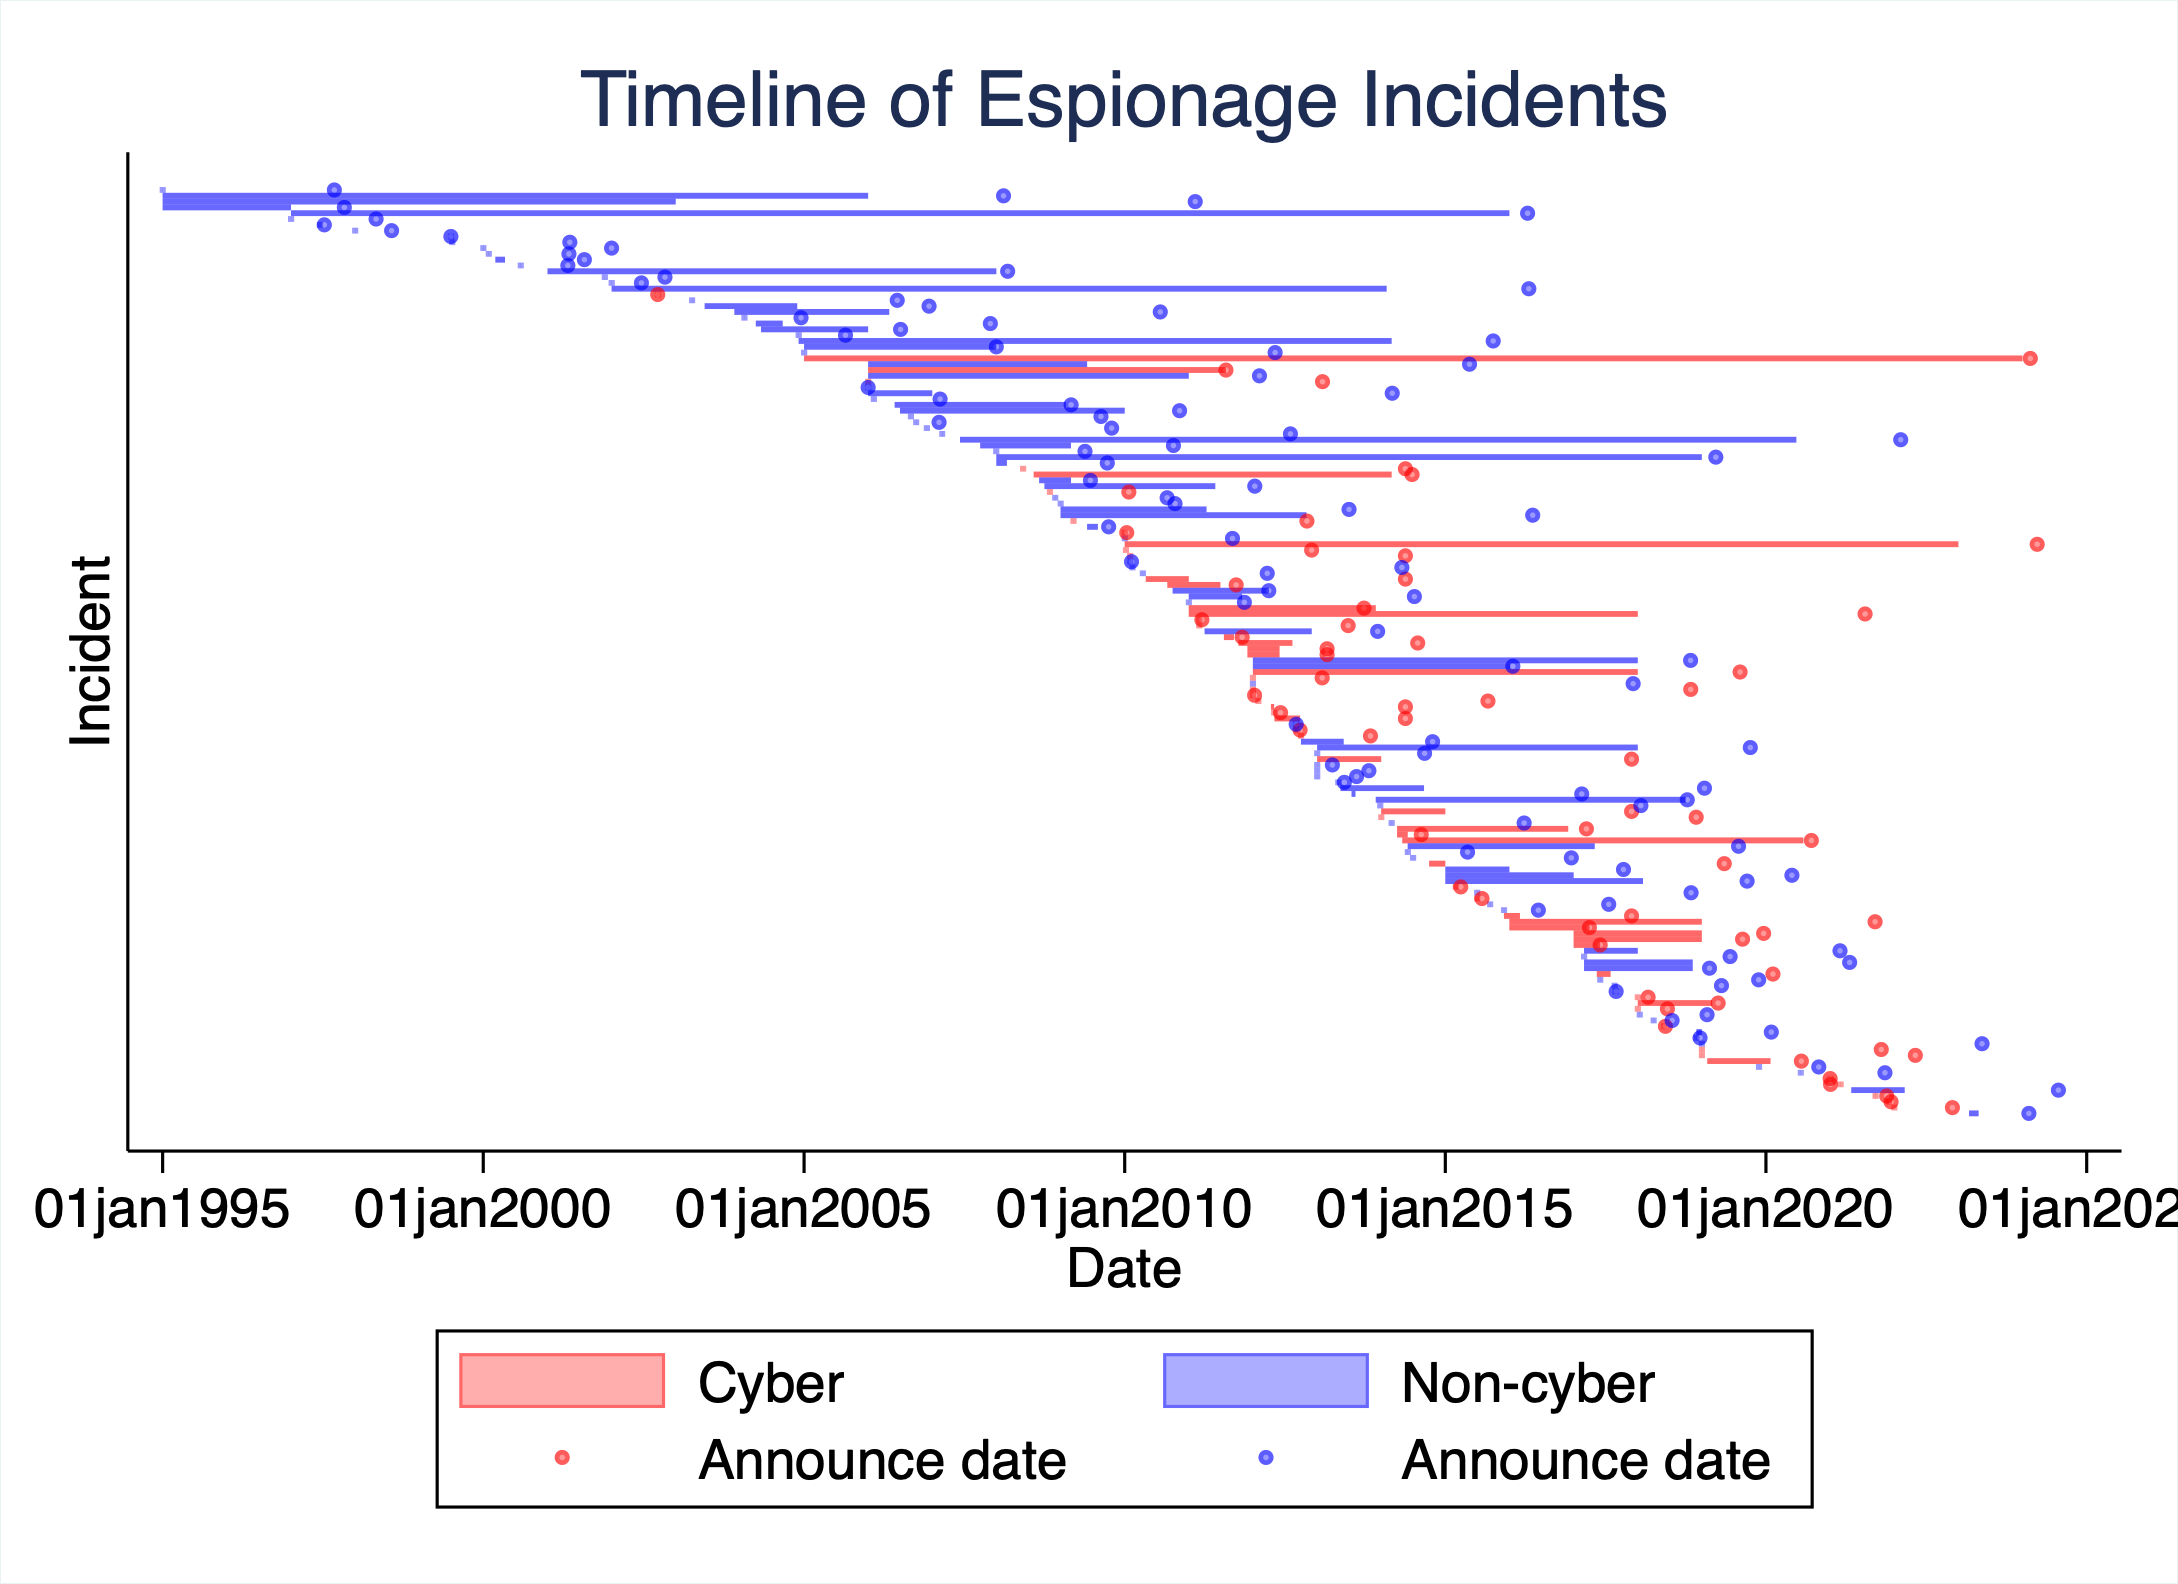
Note: This figure presents a timeline of economic espionage incidents against firms in the United States since 1995. Each row contains a separate incident. The shaded bars span the duration in which espionage occurs (the beginning of the bar corresponds to when espionage began, and the ends of the bar correspond to when the proprietary information was last successfully extracted, or when the suspect was caught if they were caught). The announcement date indicates the date in which the espionage incident was first announced to the public. Incidents that are primarily cyber in nature are plotted in red, while non-cyber incidents are plotted in blue.
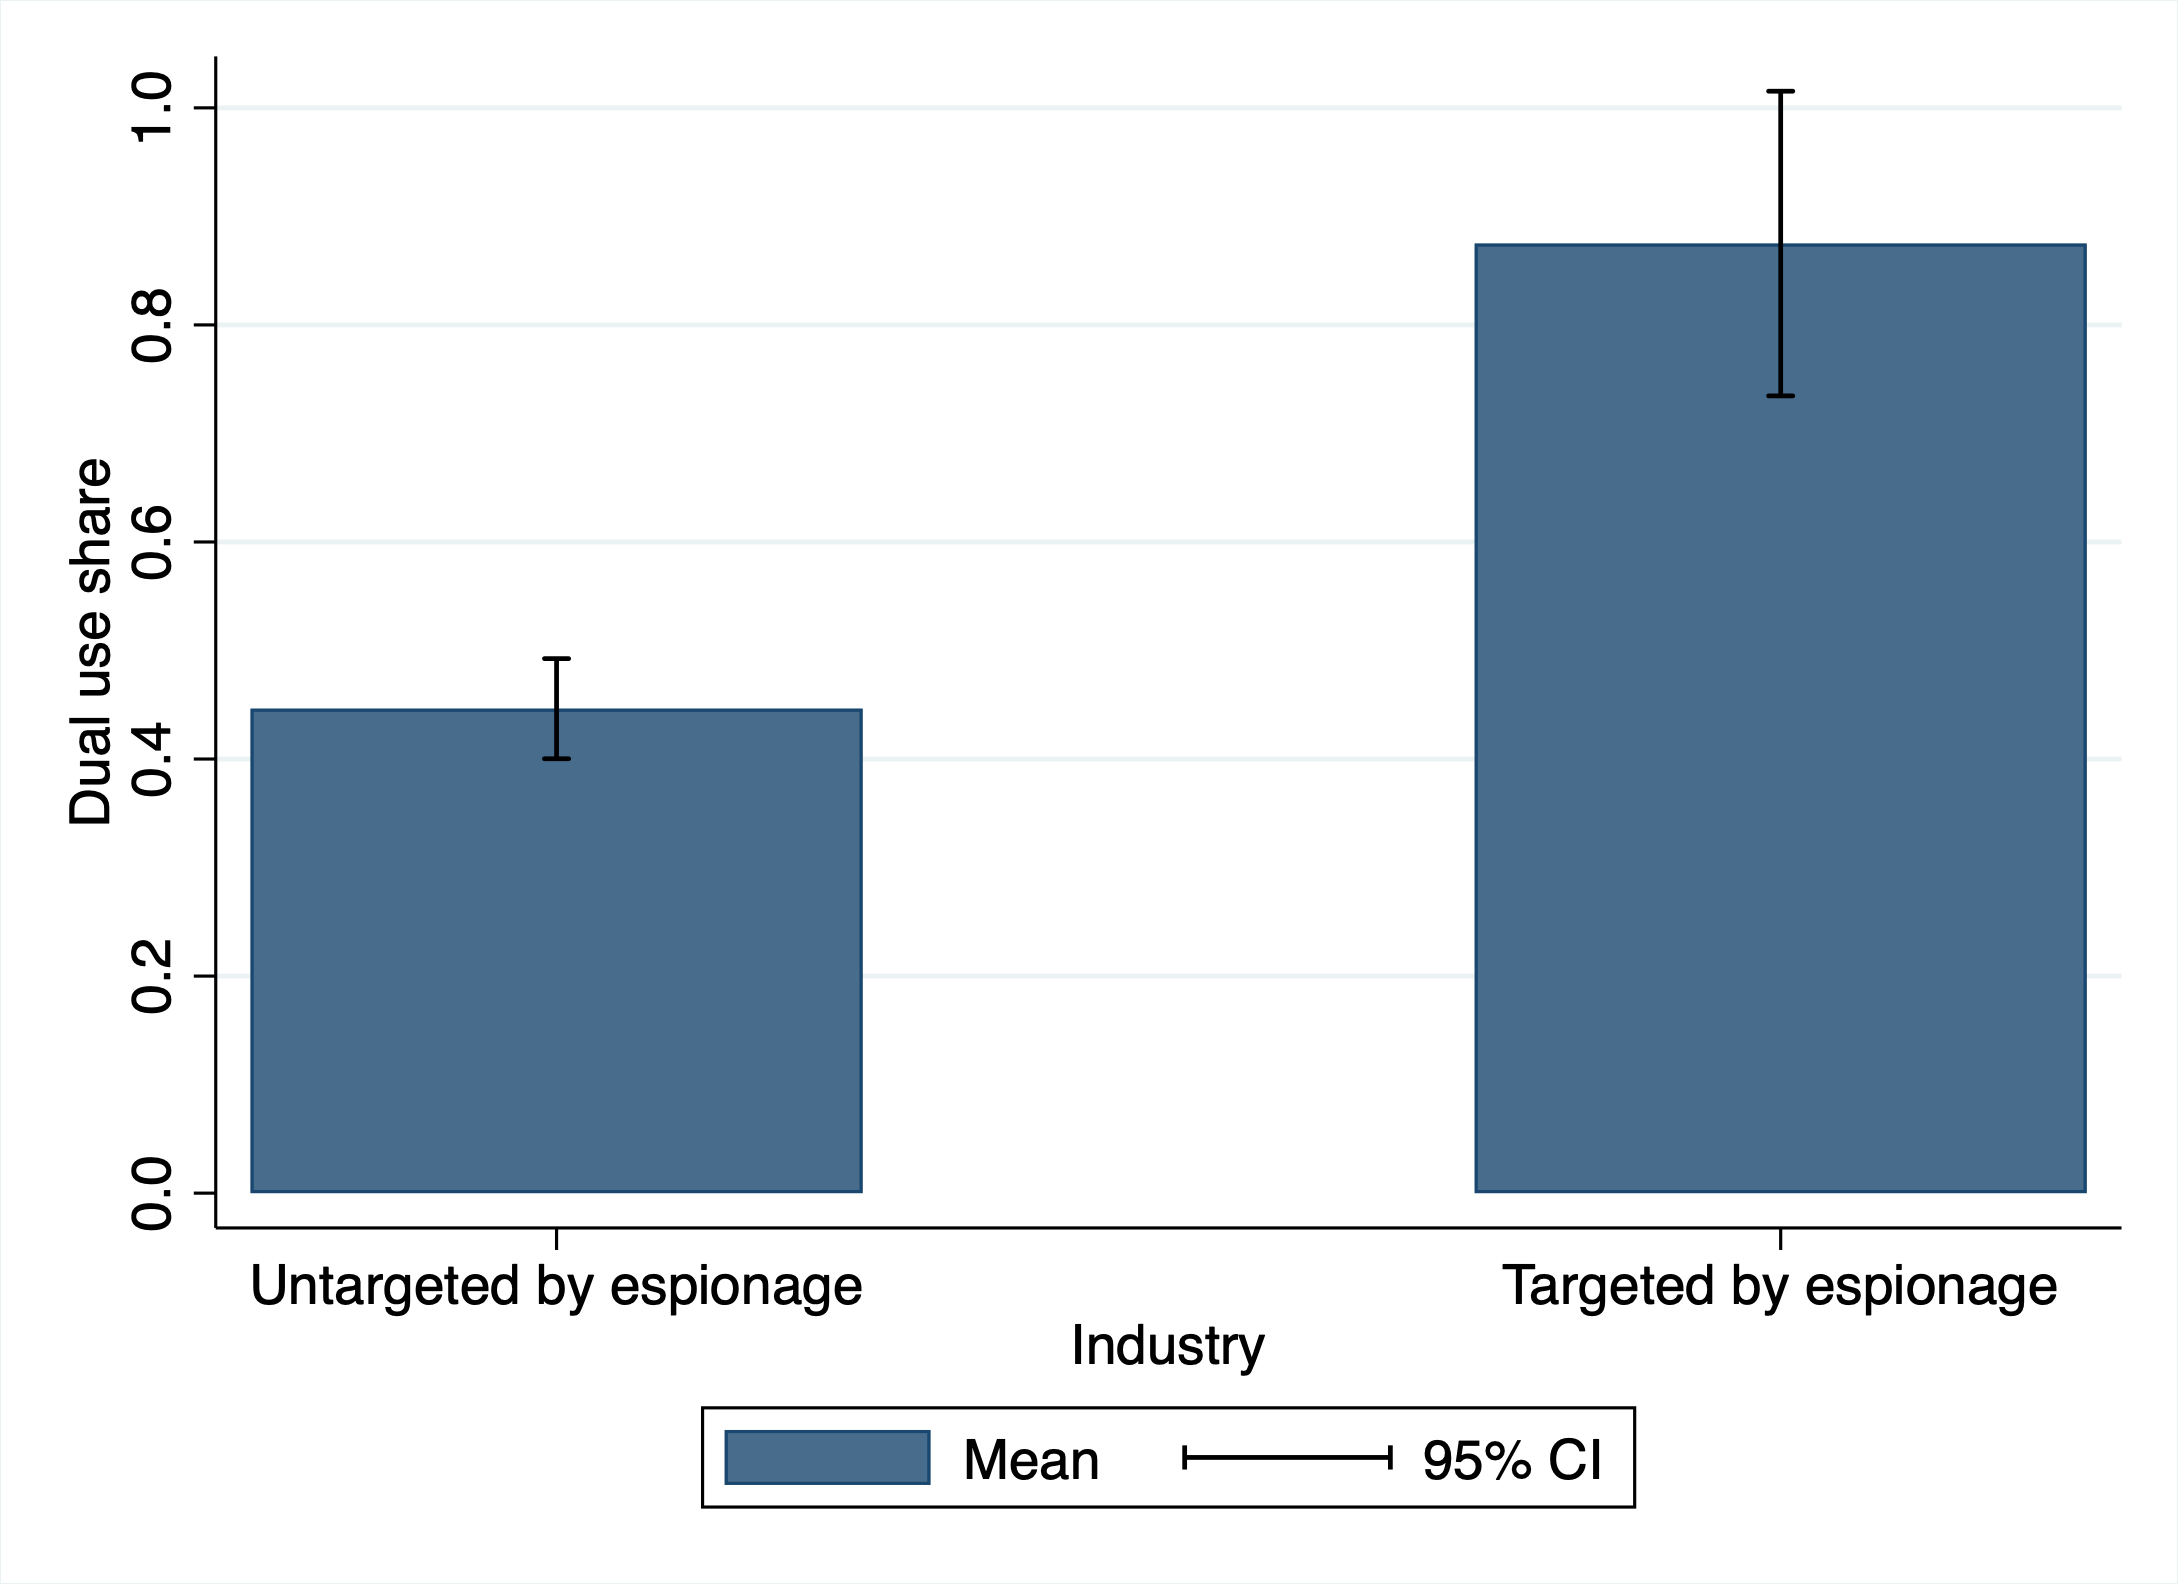
Note: This figure presents sample means and 95% confidence intervals of the share of industries that are dual-use, split by whether they are targeted or untargeted by espionage. Industries are classified as dual-use or not based on (Kang 2024).
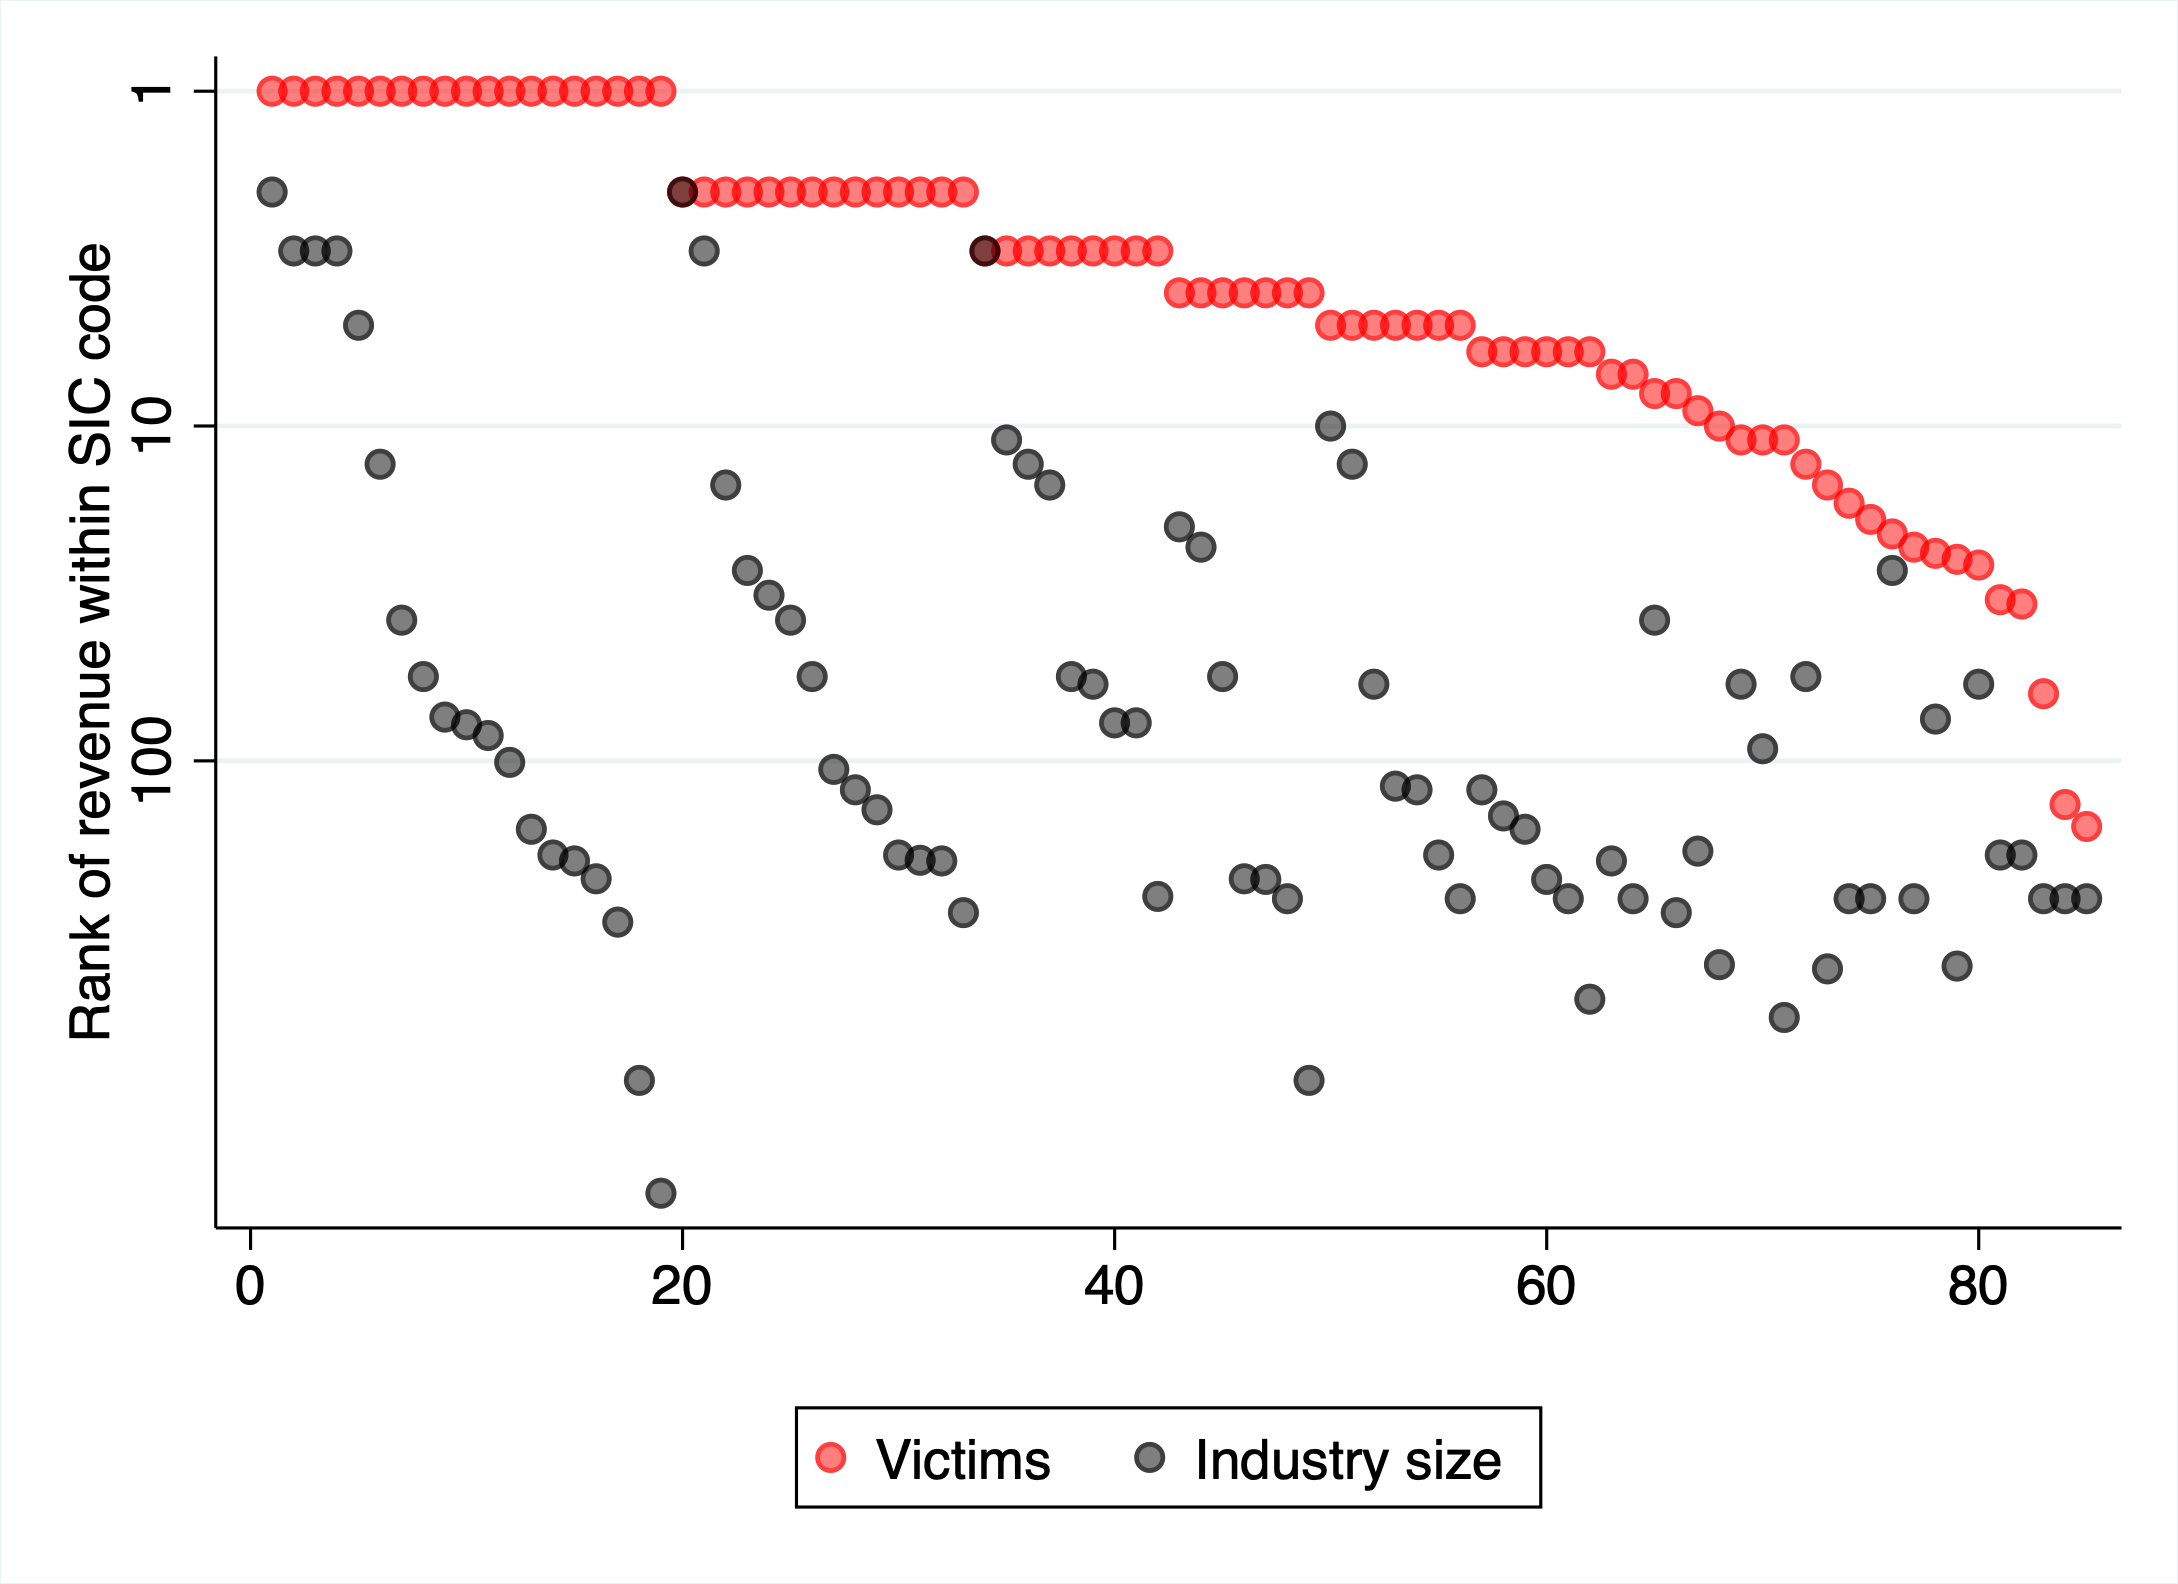
Note: This figure plots the rank of victim firm revenue within their industry (SIC code) in red, and the size of their industry in gray. Firms are ordered by rank, and then industry size. The y-axis uses a log-scale. Revenue is calculated as the average value prior to an espionage incident taking place.
Panel A: Successful cases
Panel A.1: log(Revenue) Panel A.2: log(R&D)
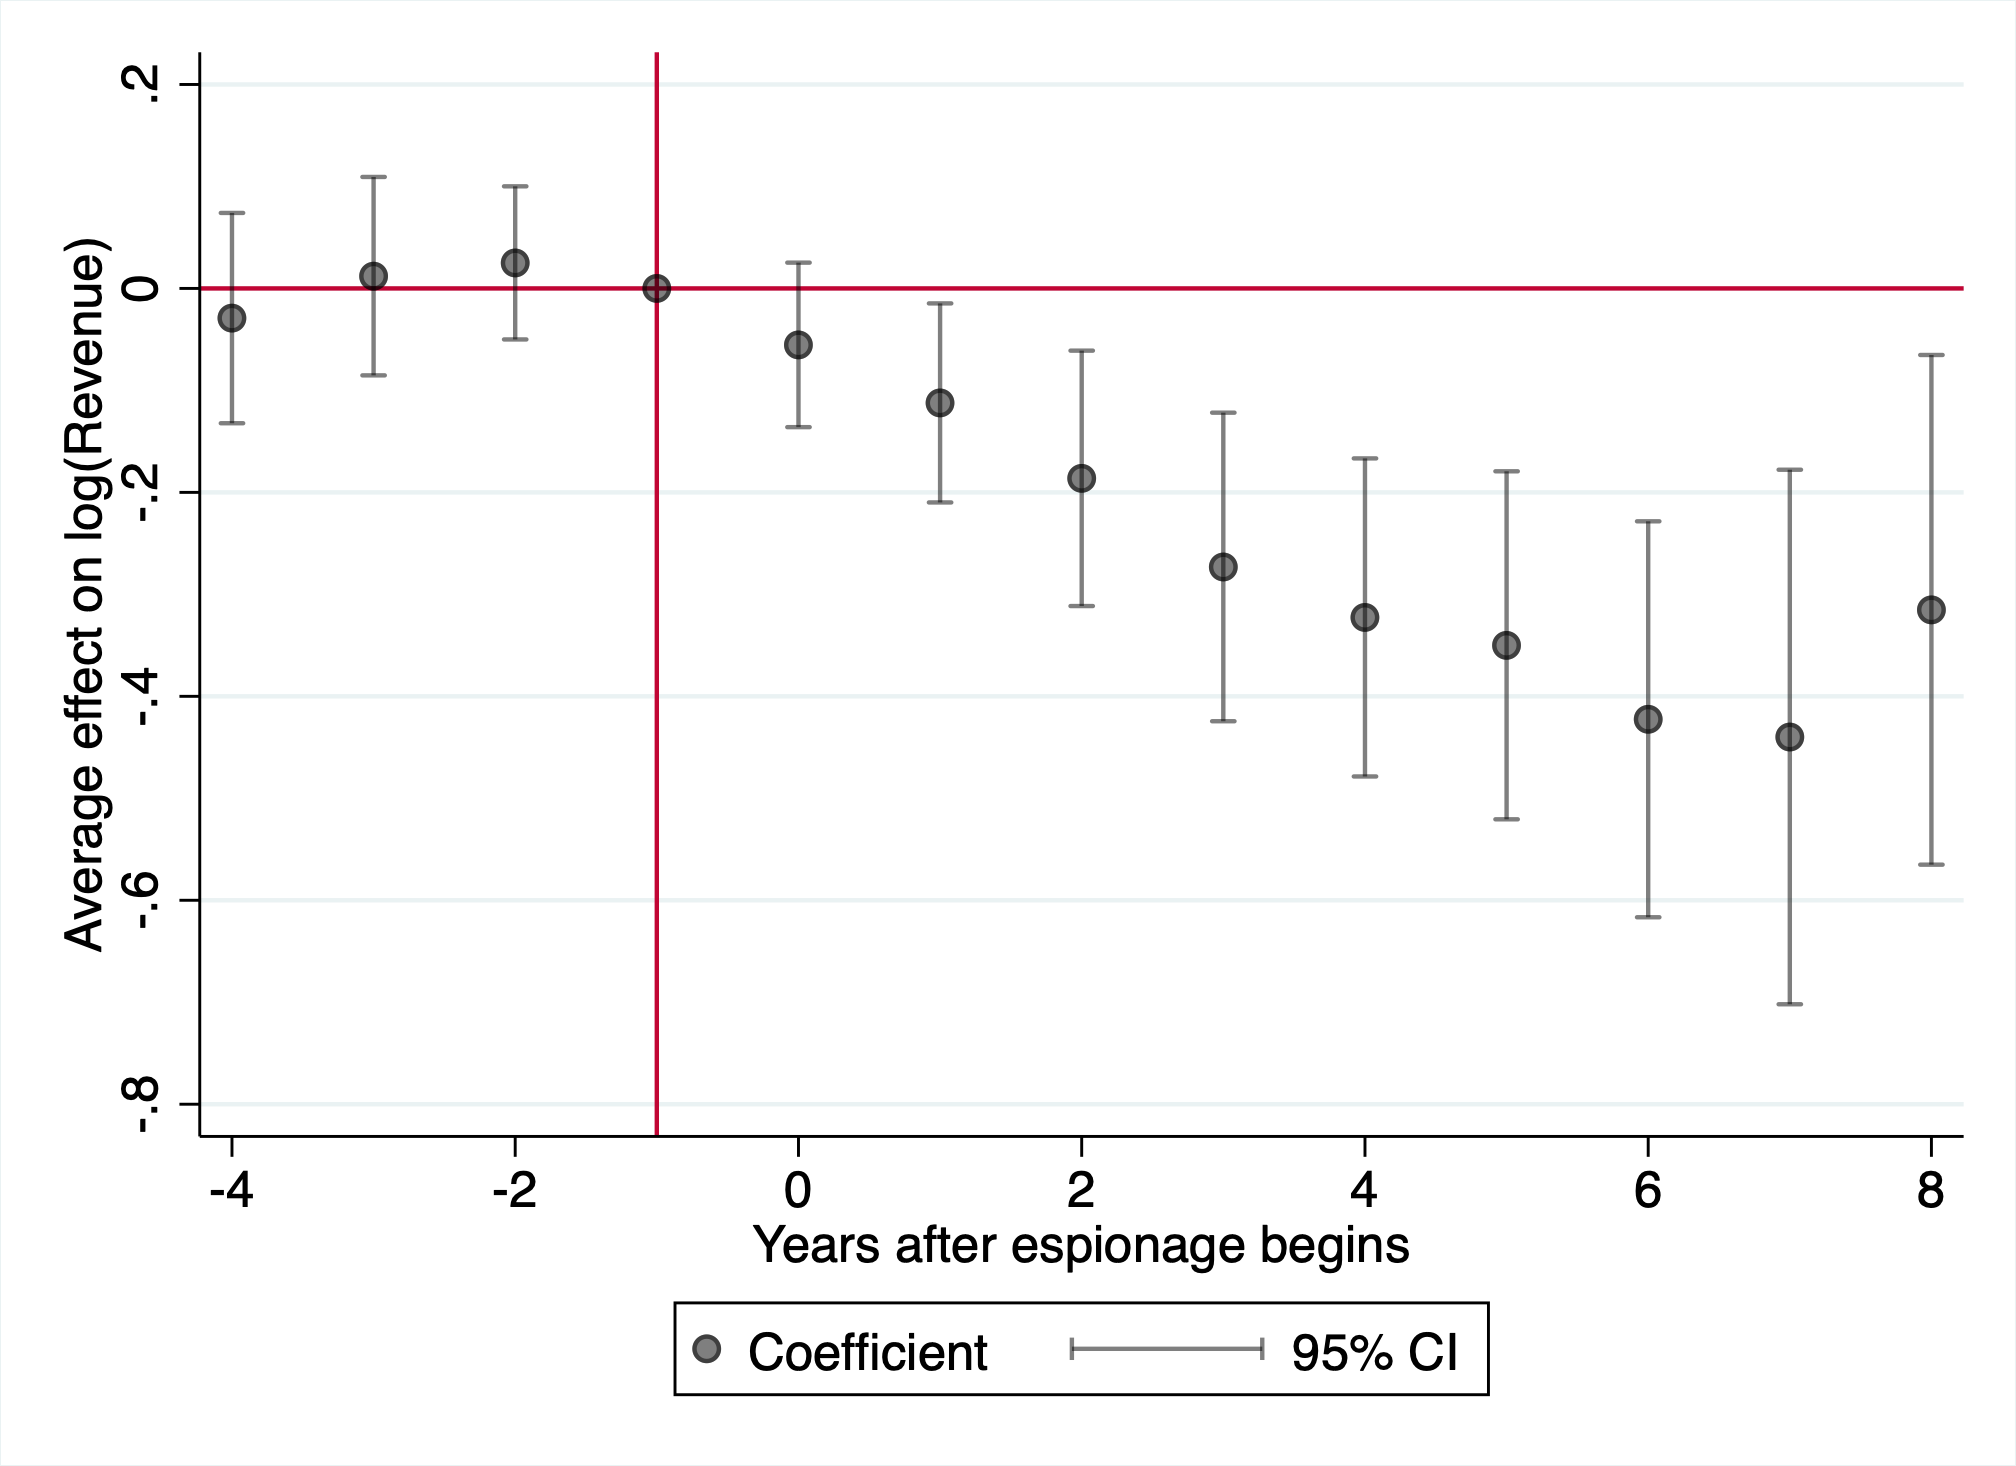
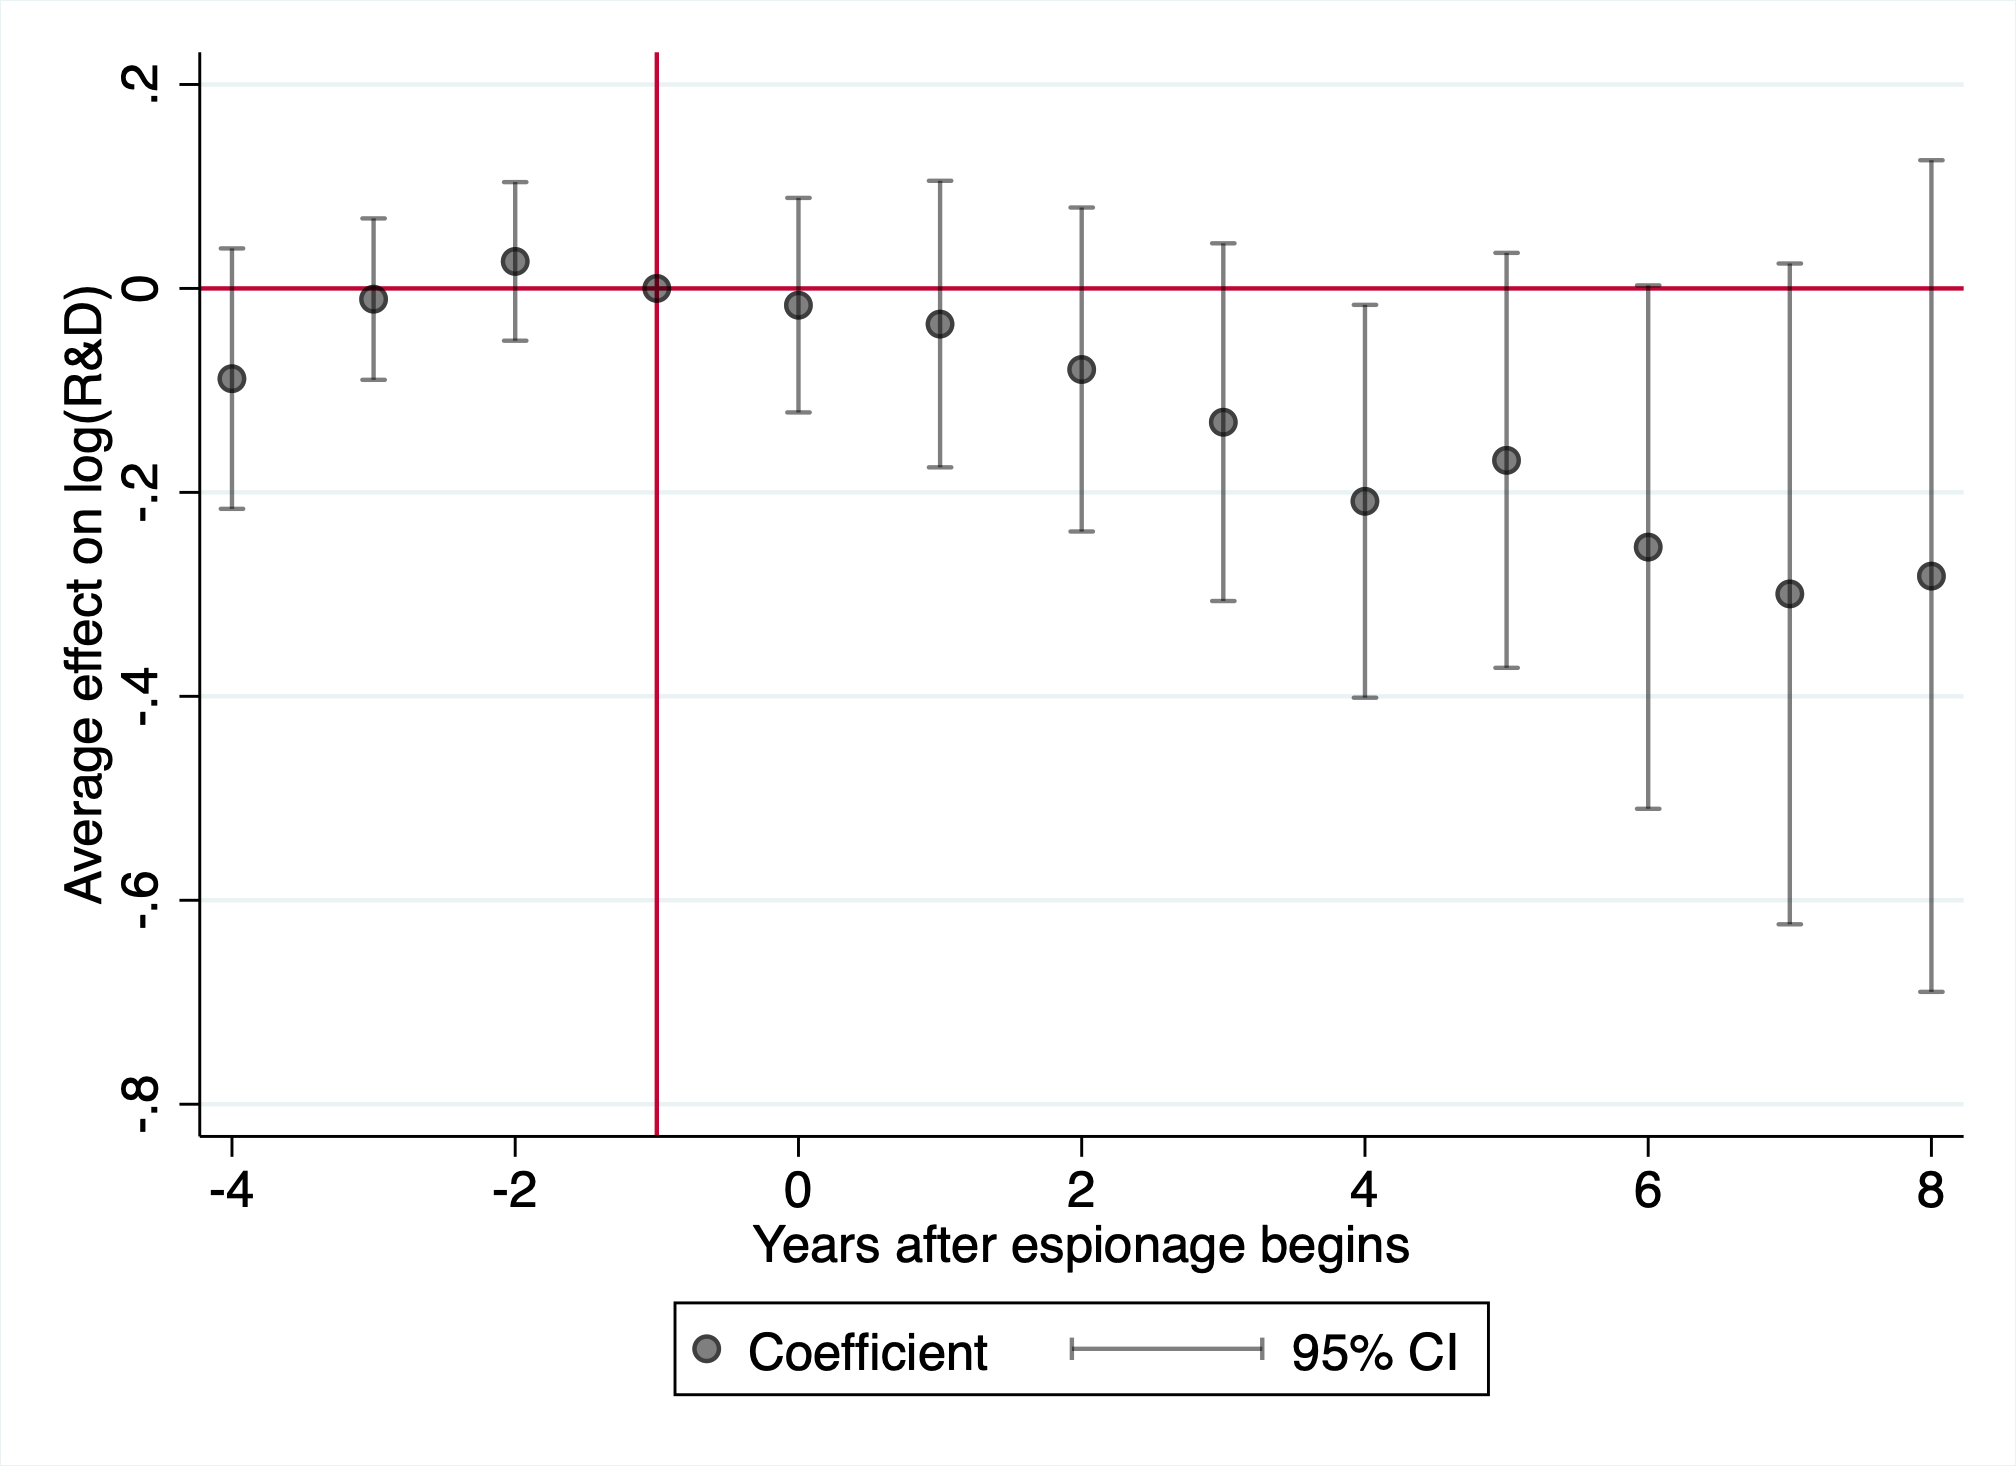
Panel B: Unsuccessful cases
Panel B.1: log(Revenue) Panel B.2: log(R&D)
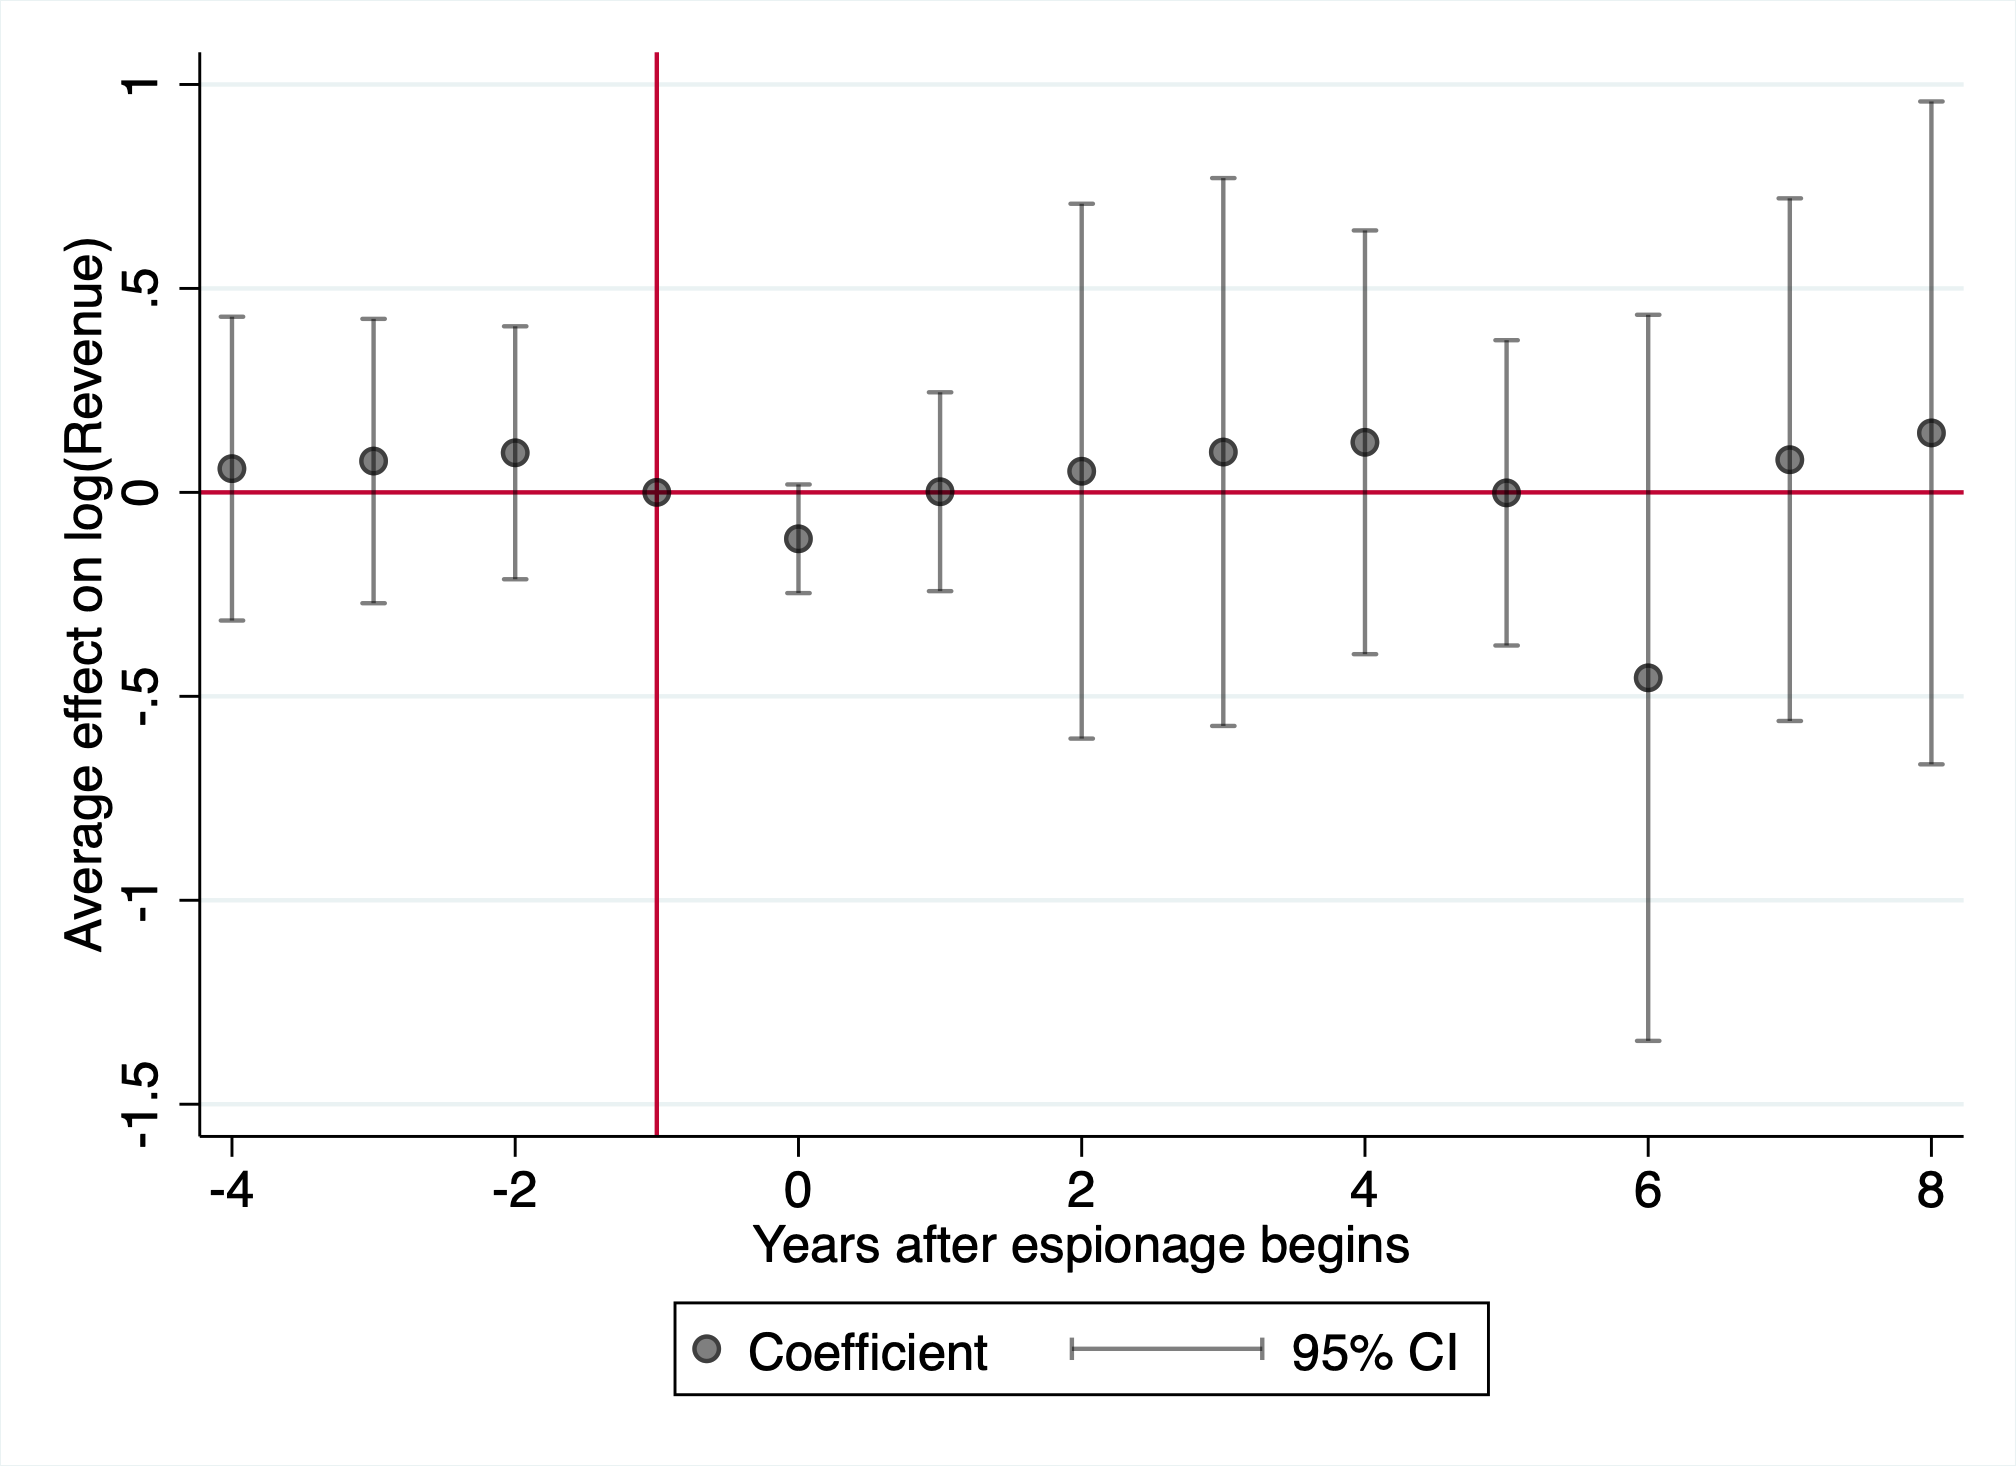
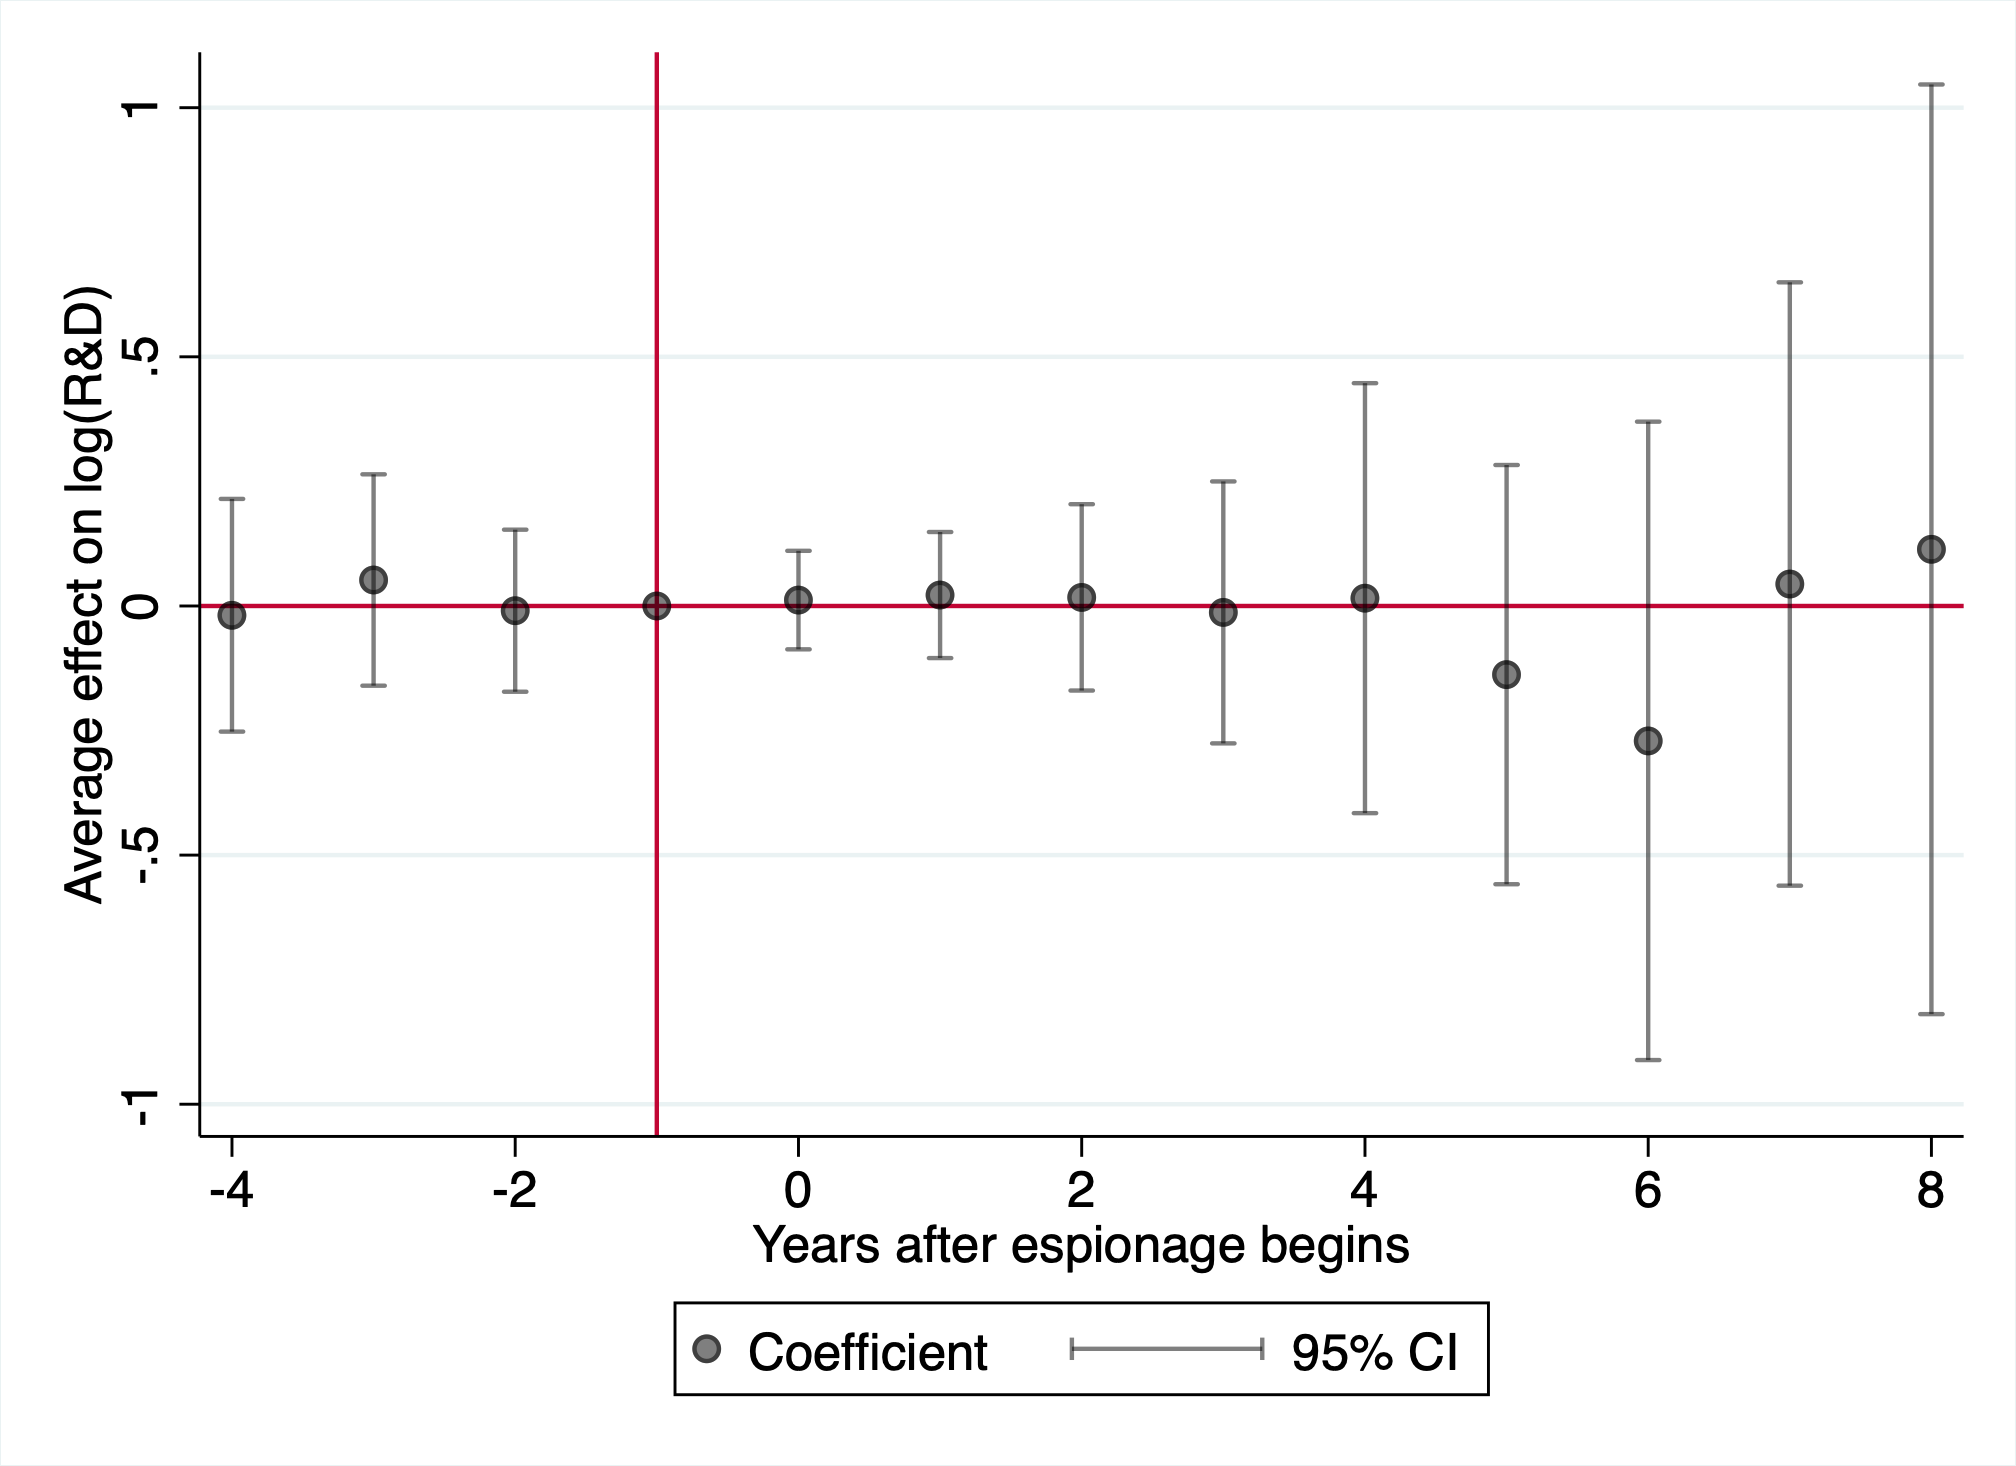
Note: This figure plots coefficients and 95% confidence intervals from a two-way fixed effects event study regression. In Panel A, an event is a firm being successfully targeted for economic espionage. In Panel B, events are unsuccessful cases of economic espionage, where the desired information was not successfully given to its intended recipient. The outcome in Panels A.1 and B.1 is a firm’s log(Revenue) and in Panels A.2 and B.2, a firm’s log(R&D expenditures). Standard errors are clustered at the firm level.
Panel A.1: By value, revenue Panel A.2: By value,
R&D
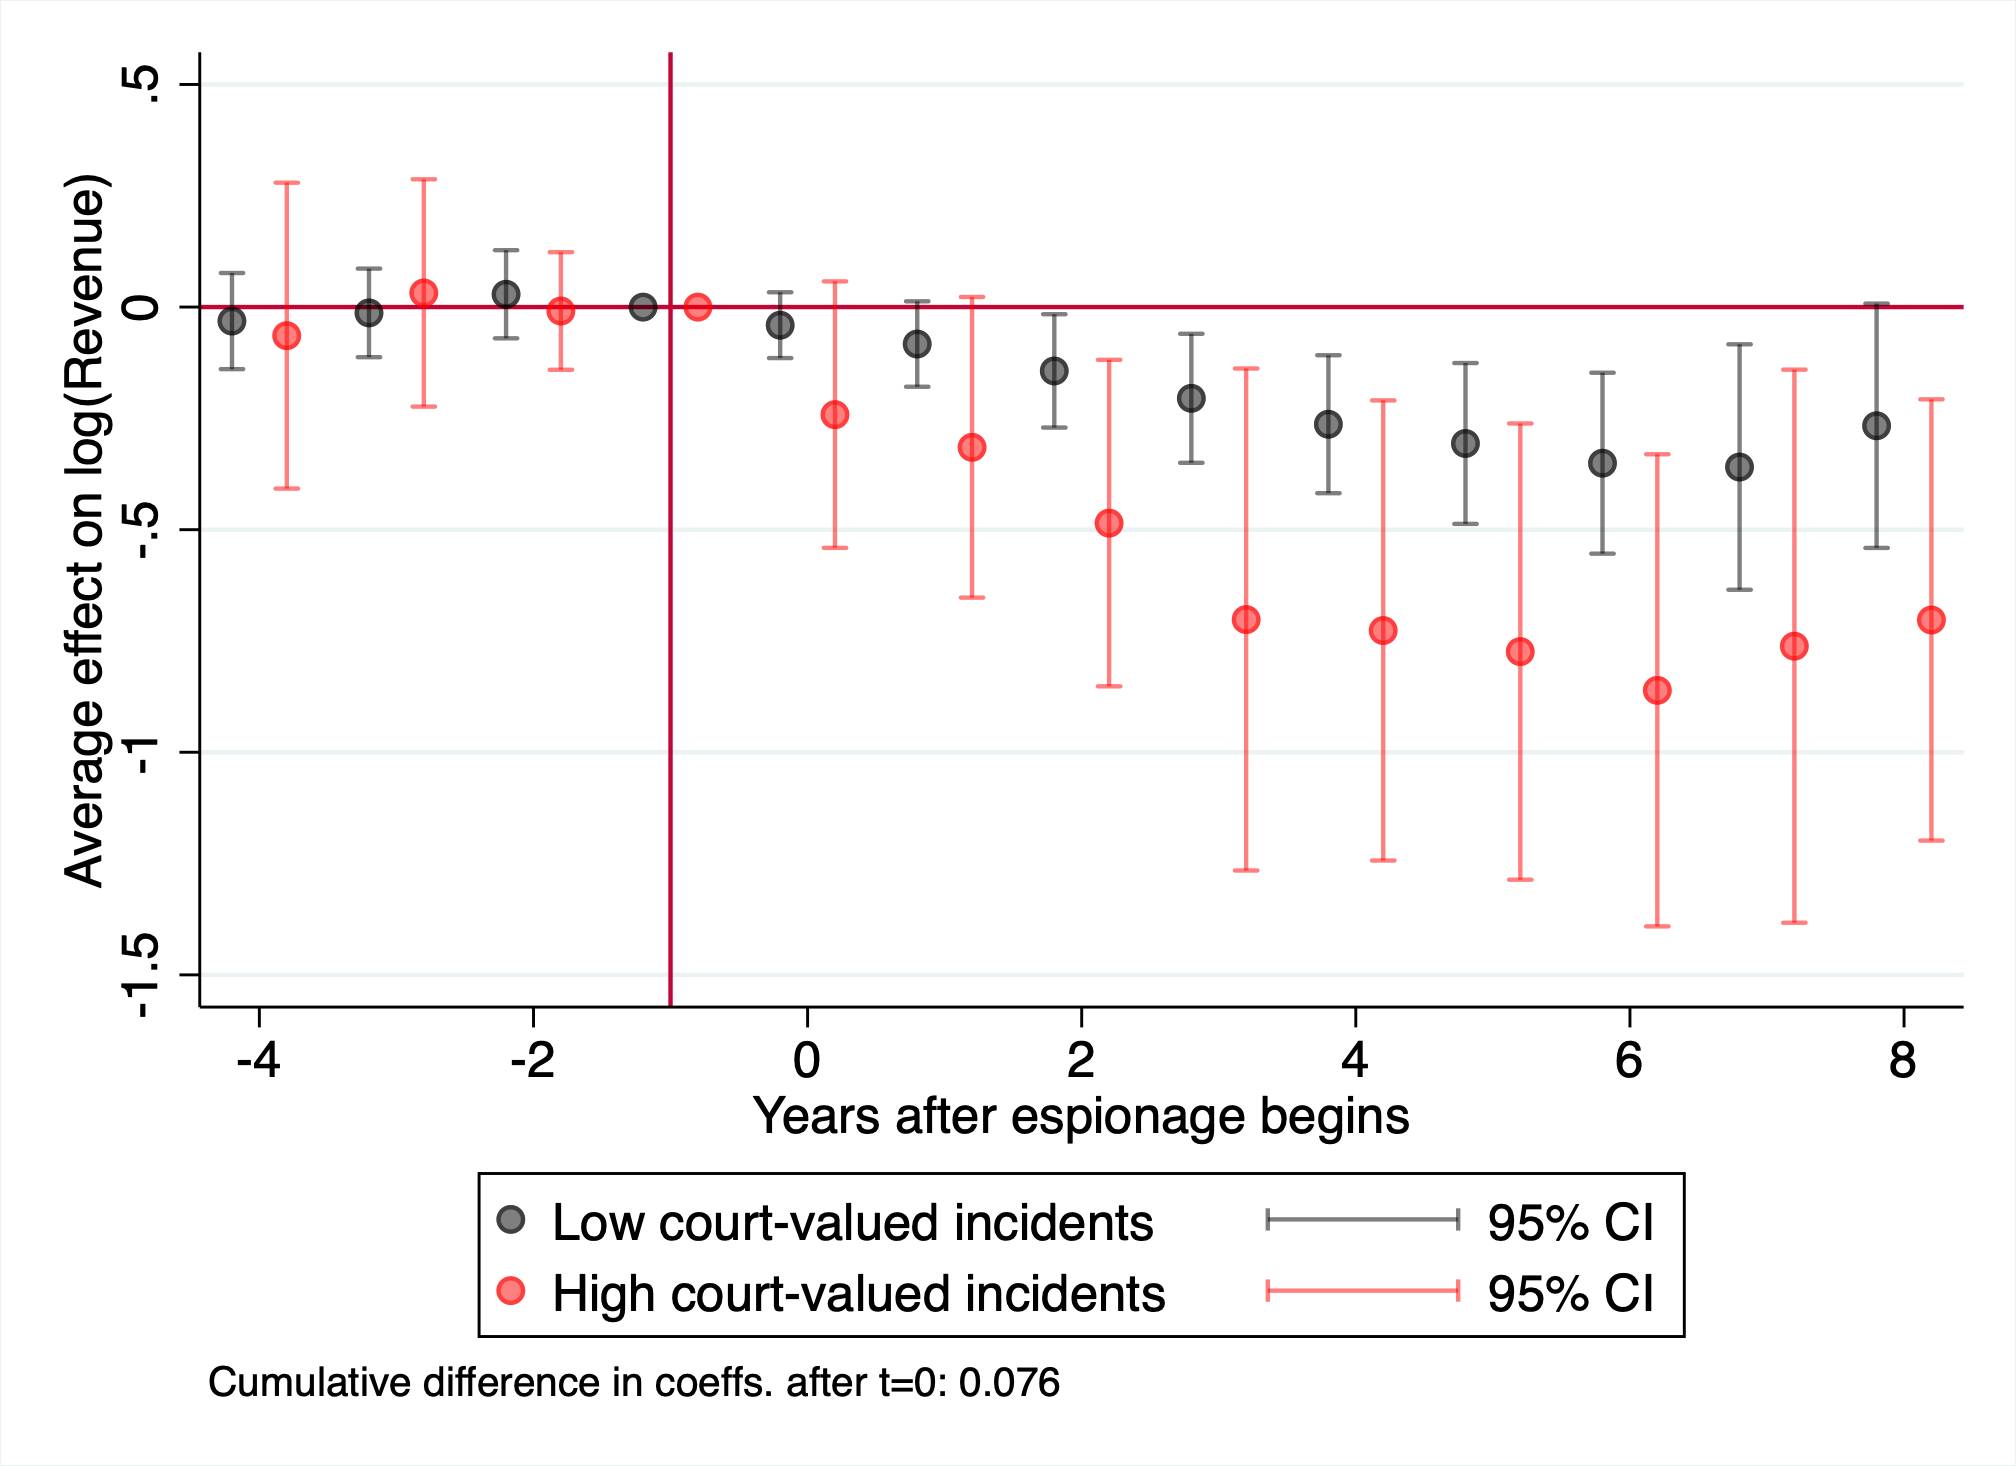
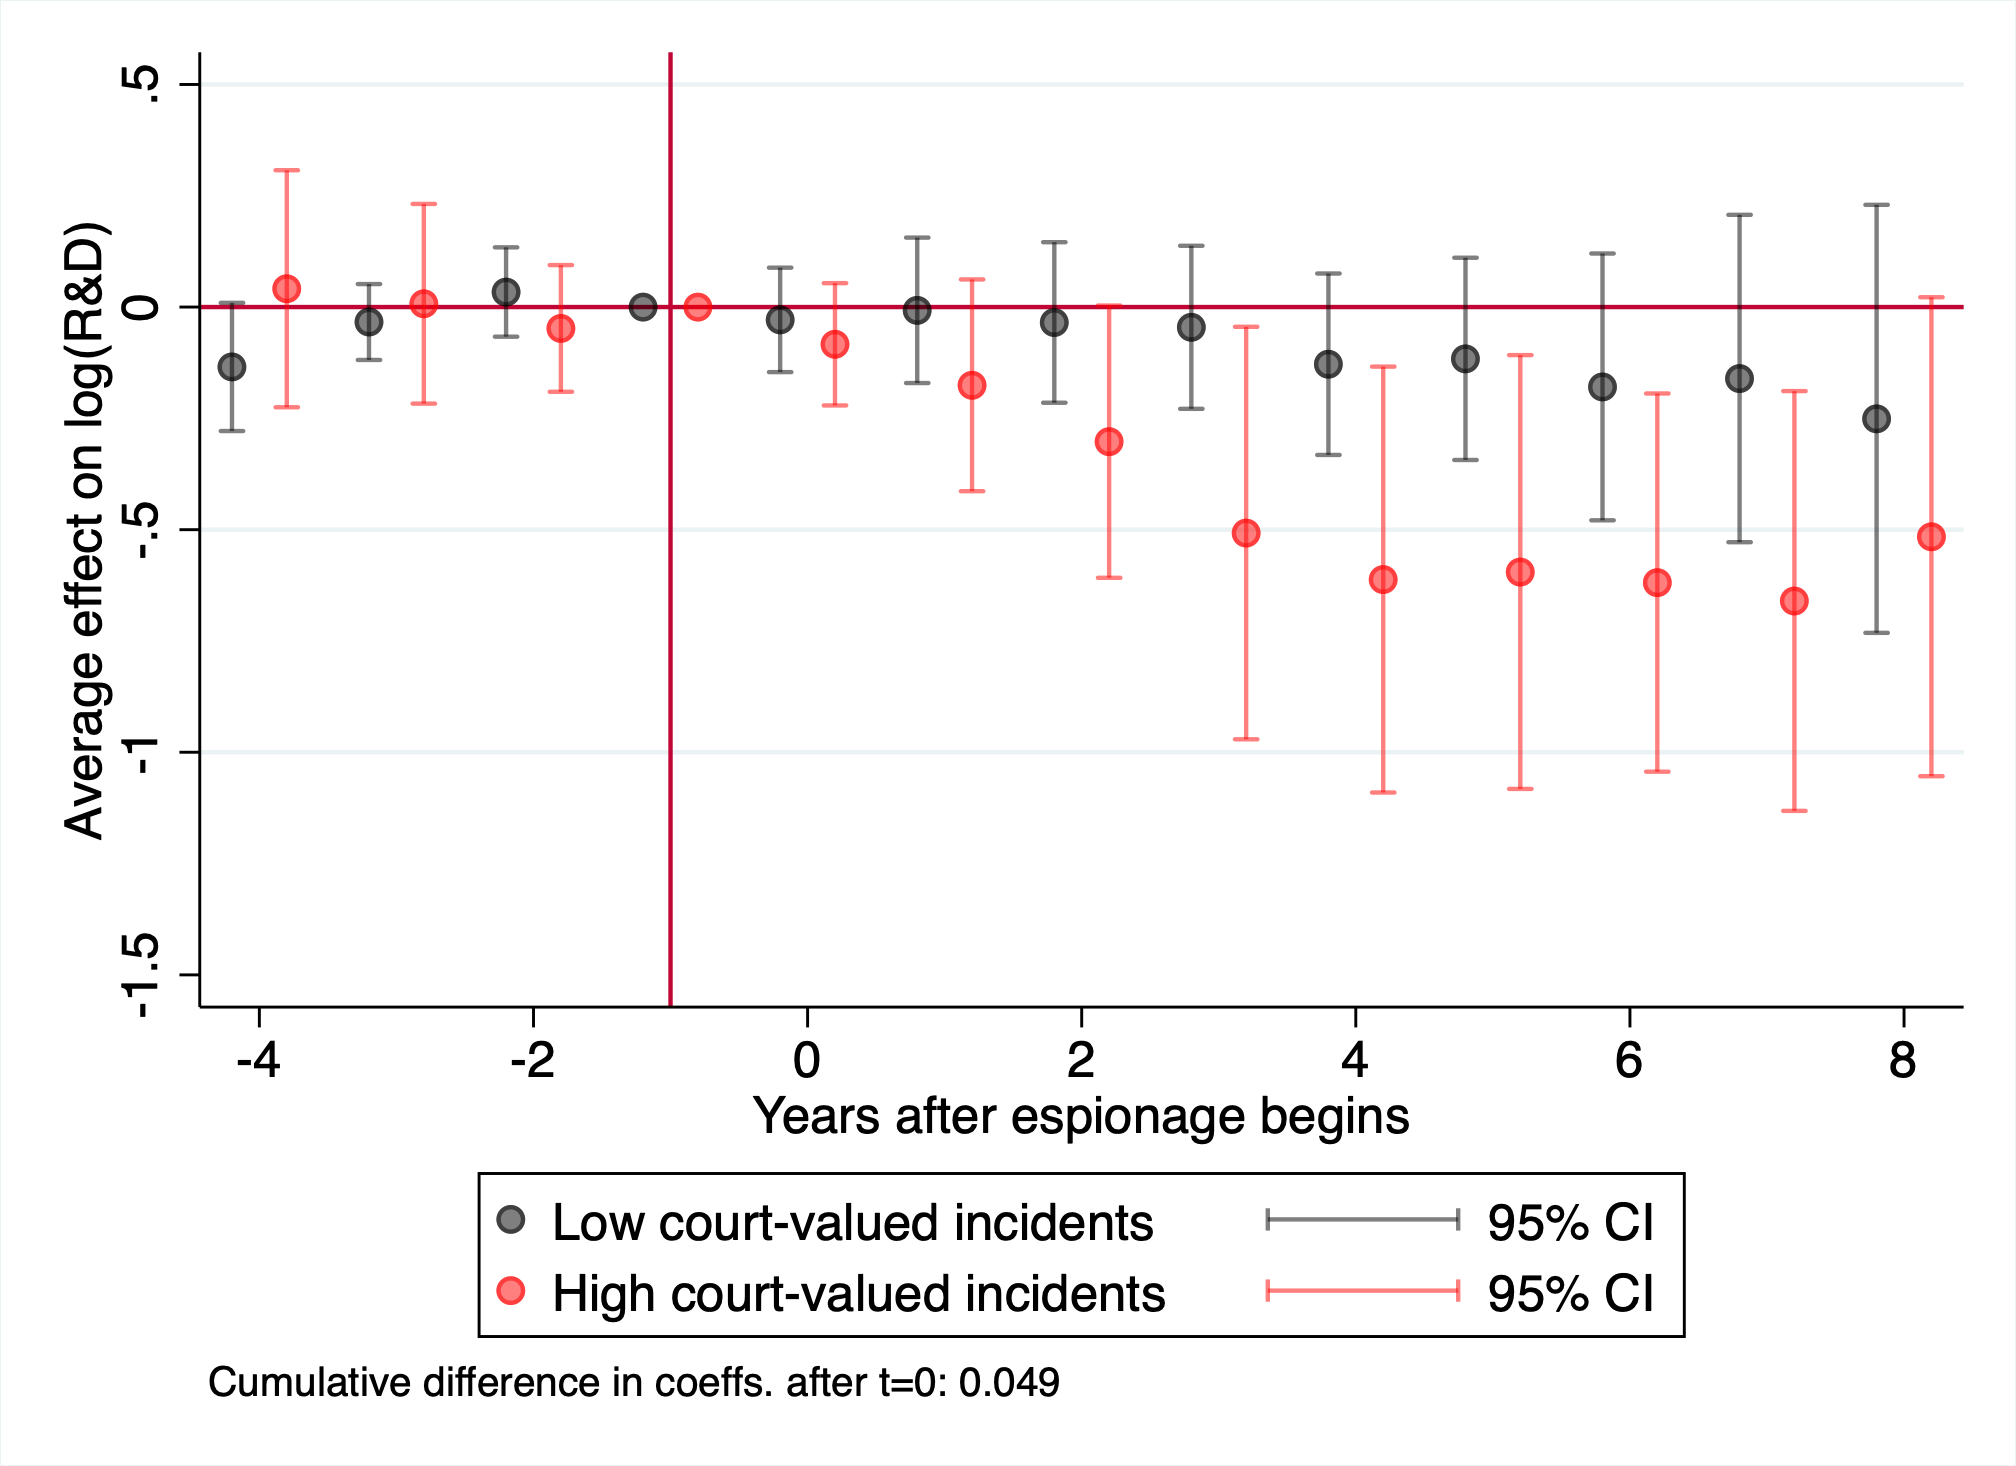
Panel B.1: By industry R&D, revenue Panel B.2: By
industry R&D, R&D
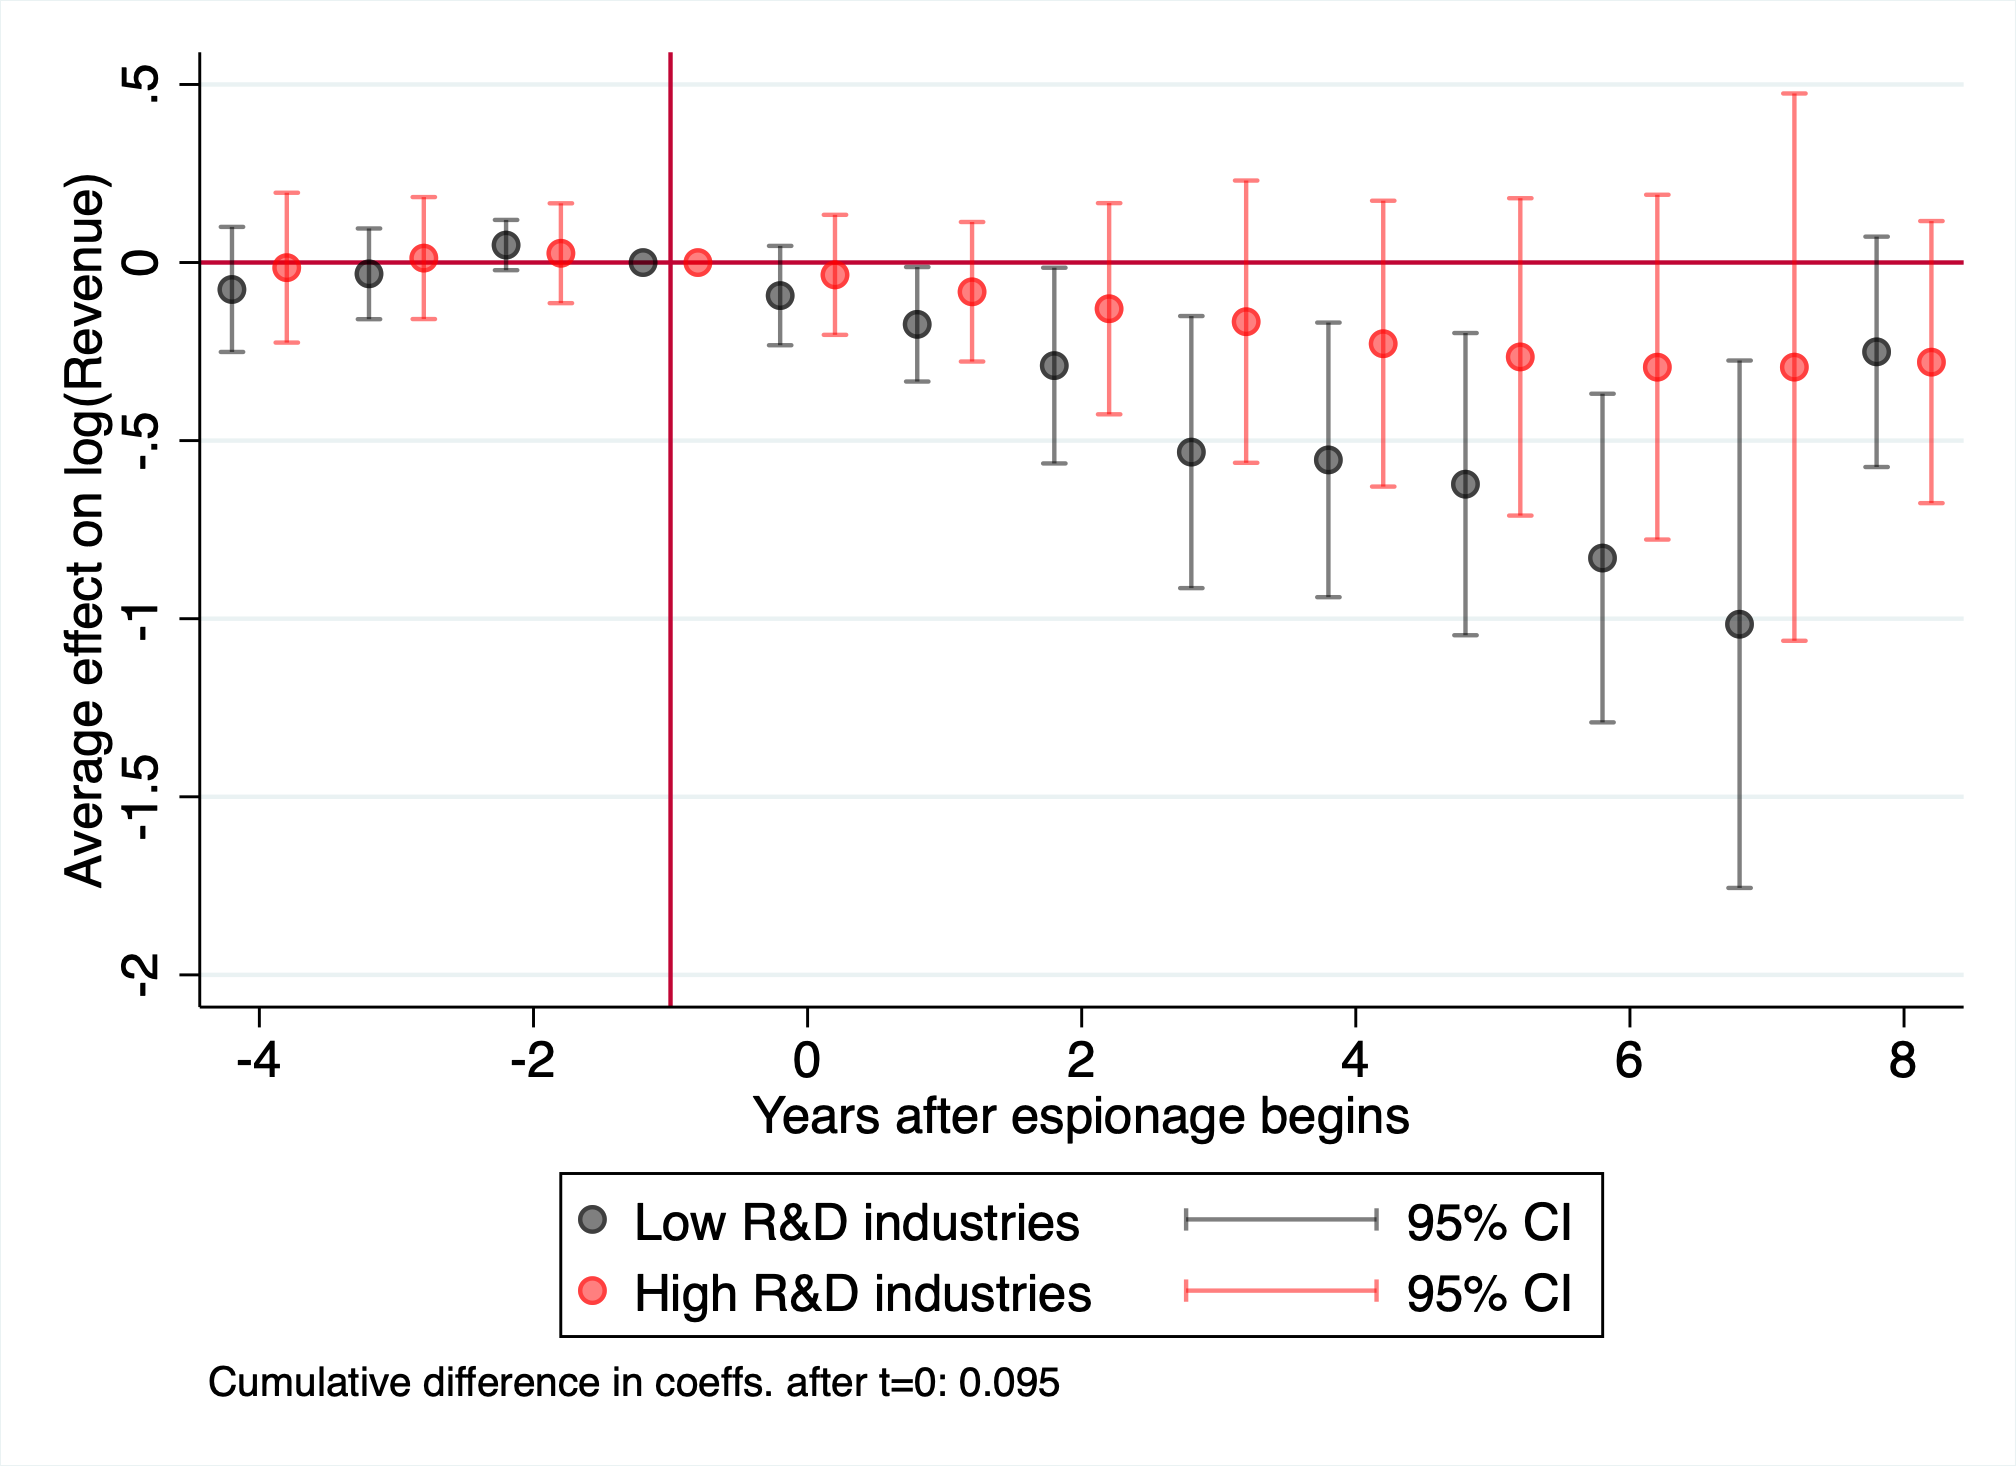
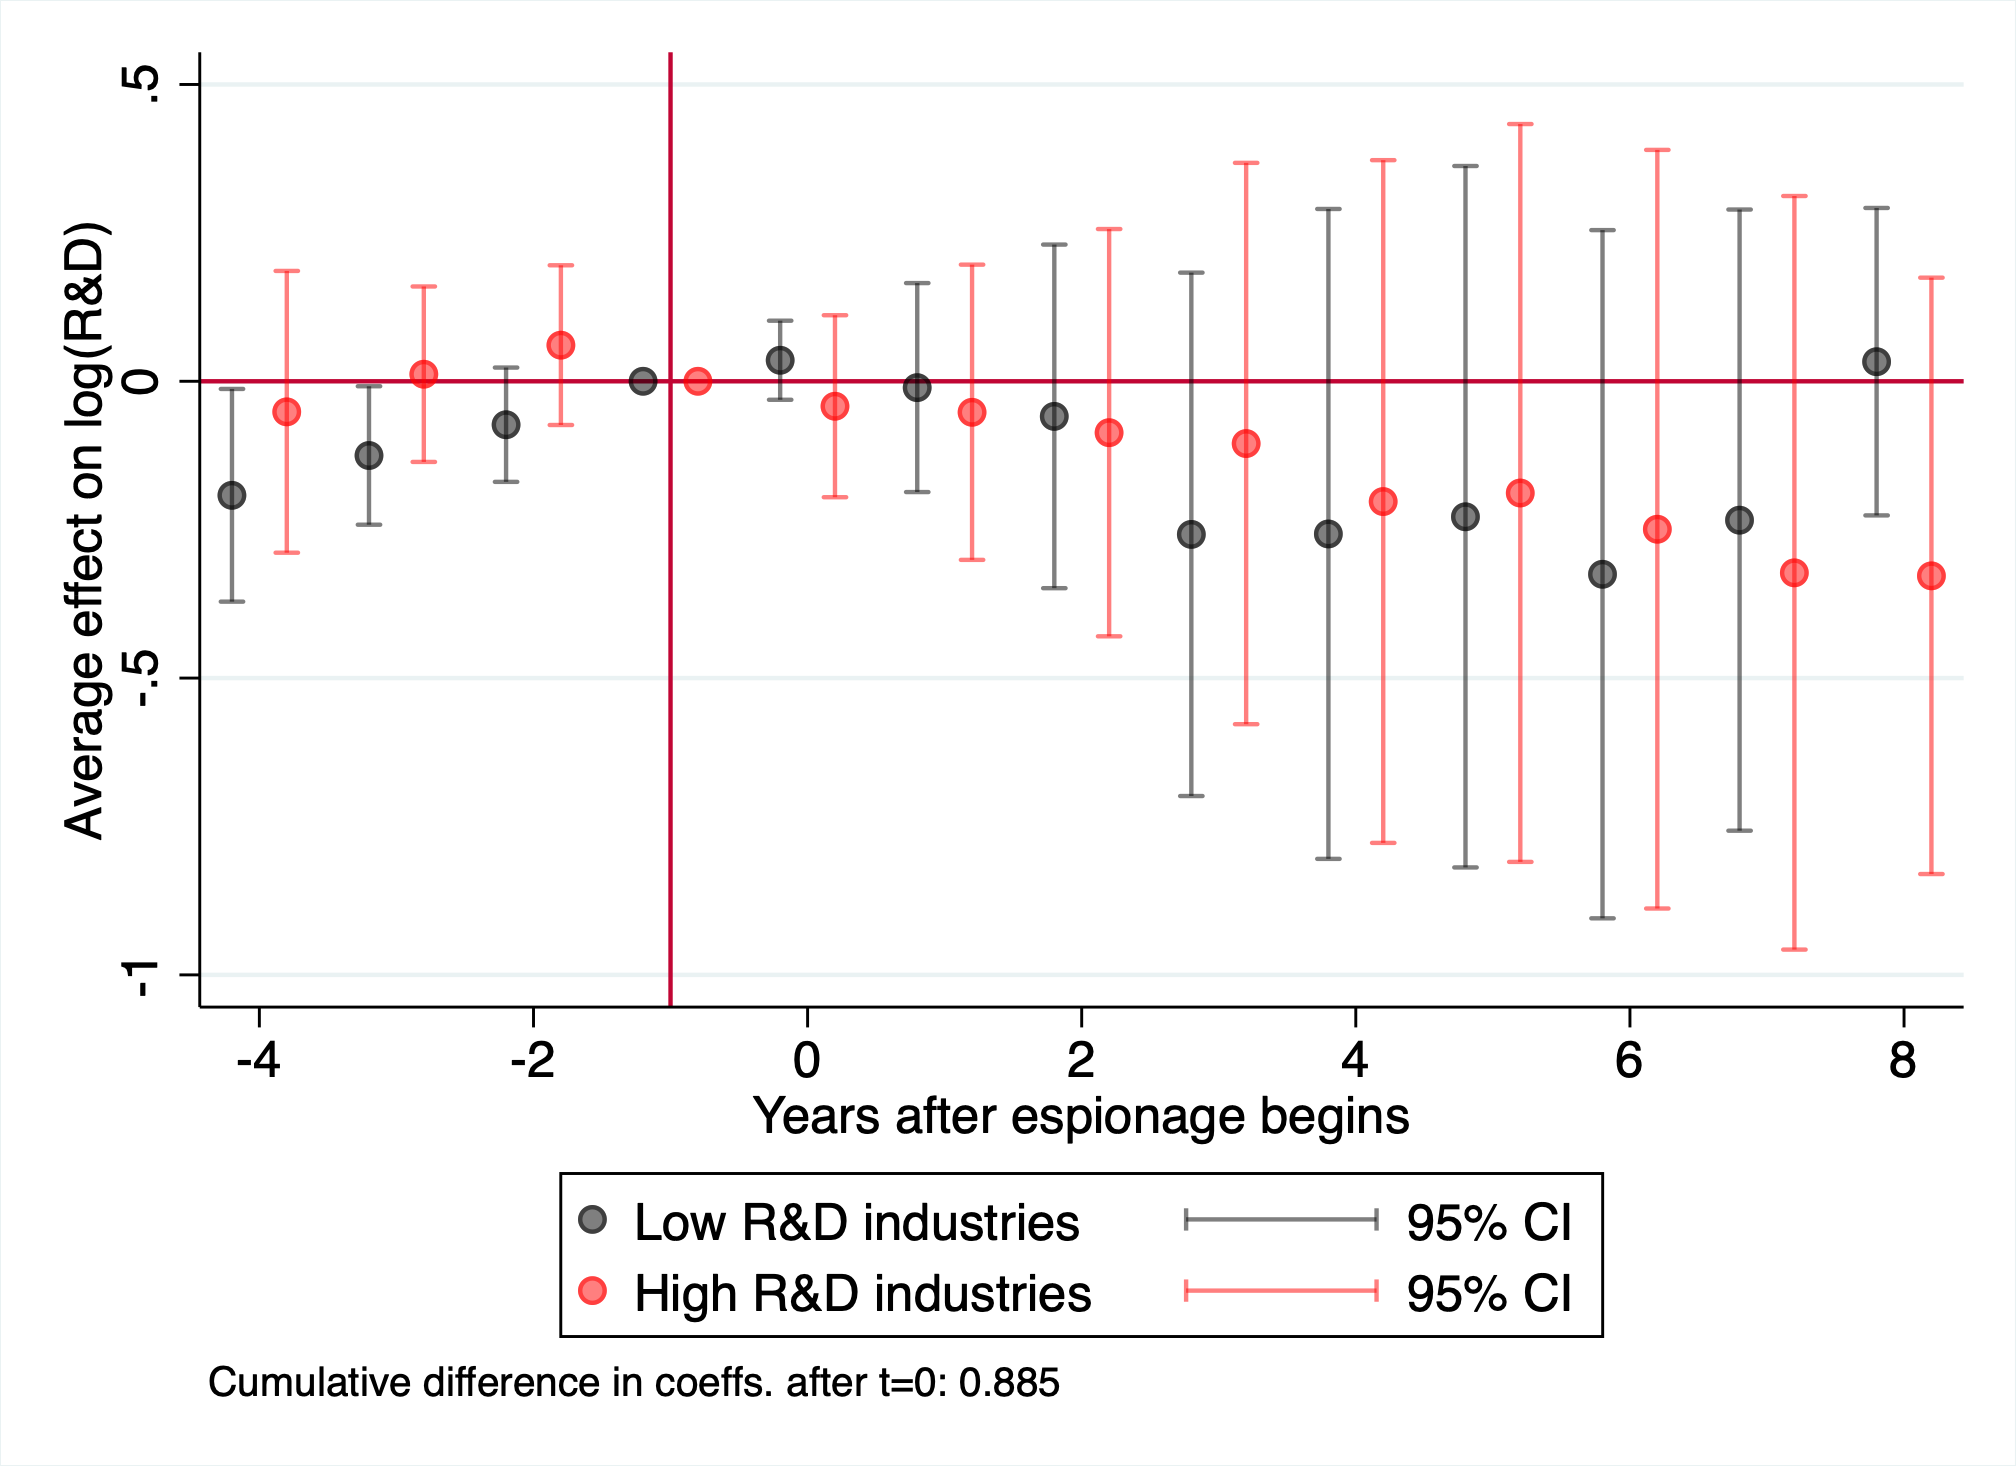
Panel C.1: By patent value HHI, revenue Panel C.2: By patent
value HHI, R&D
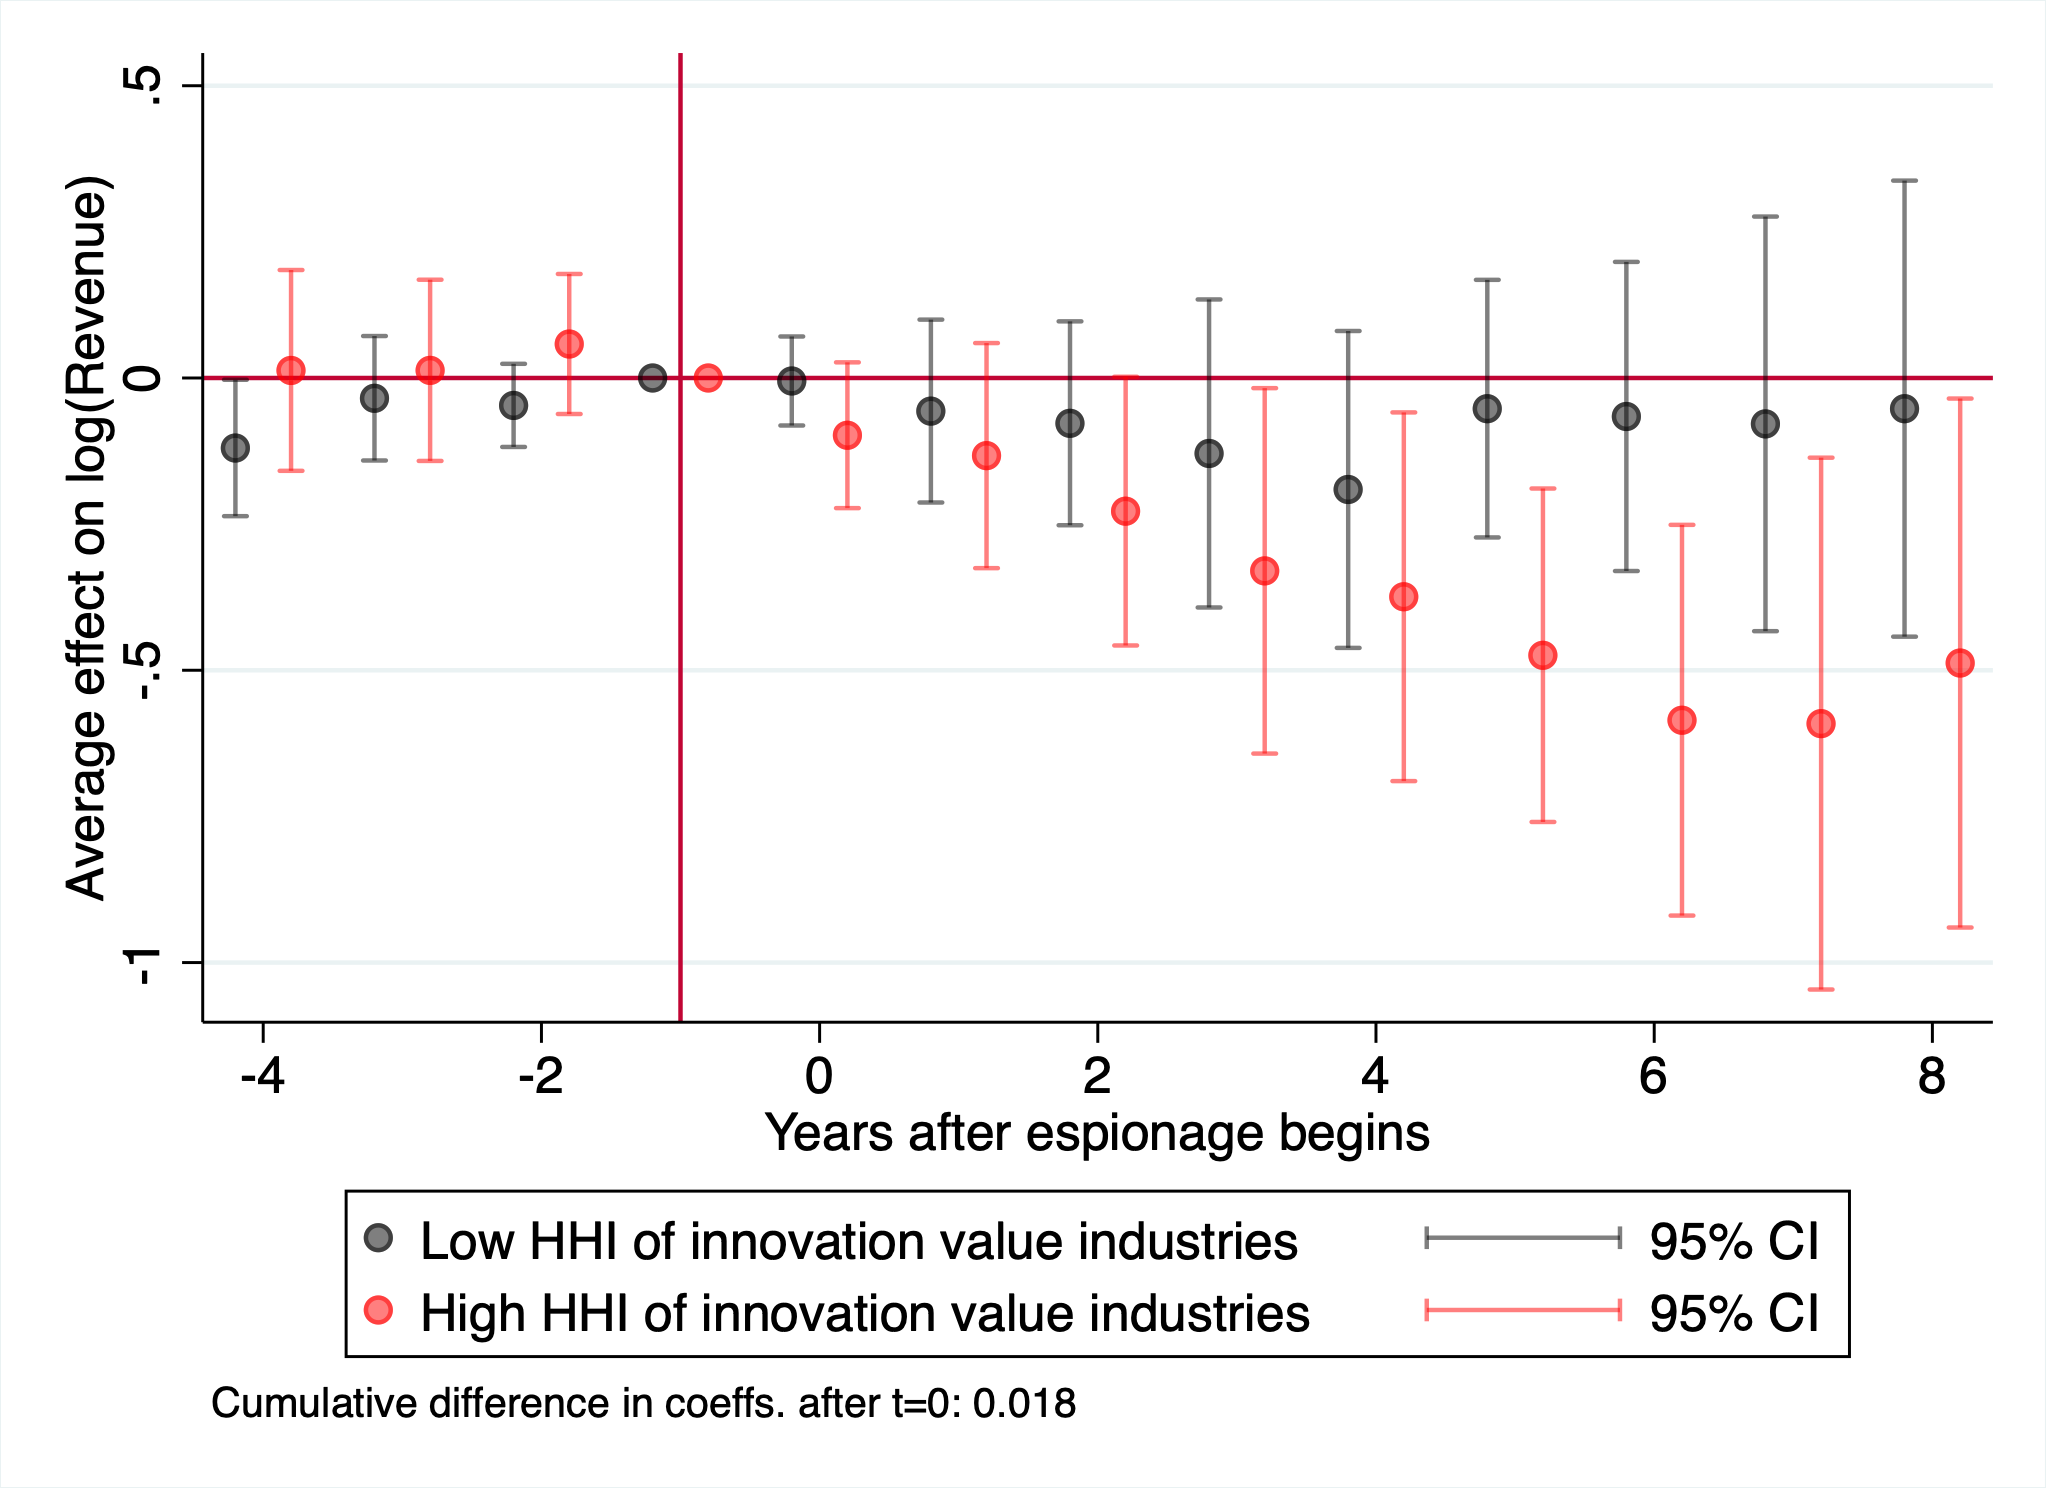
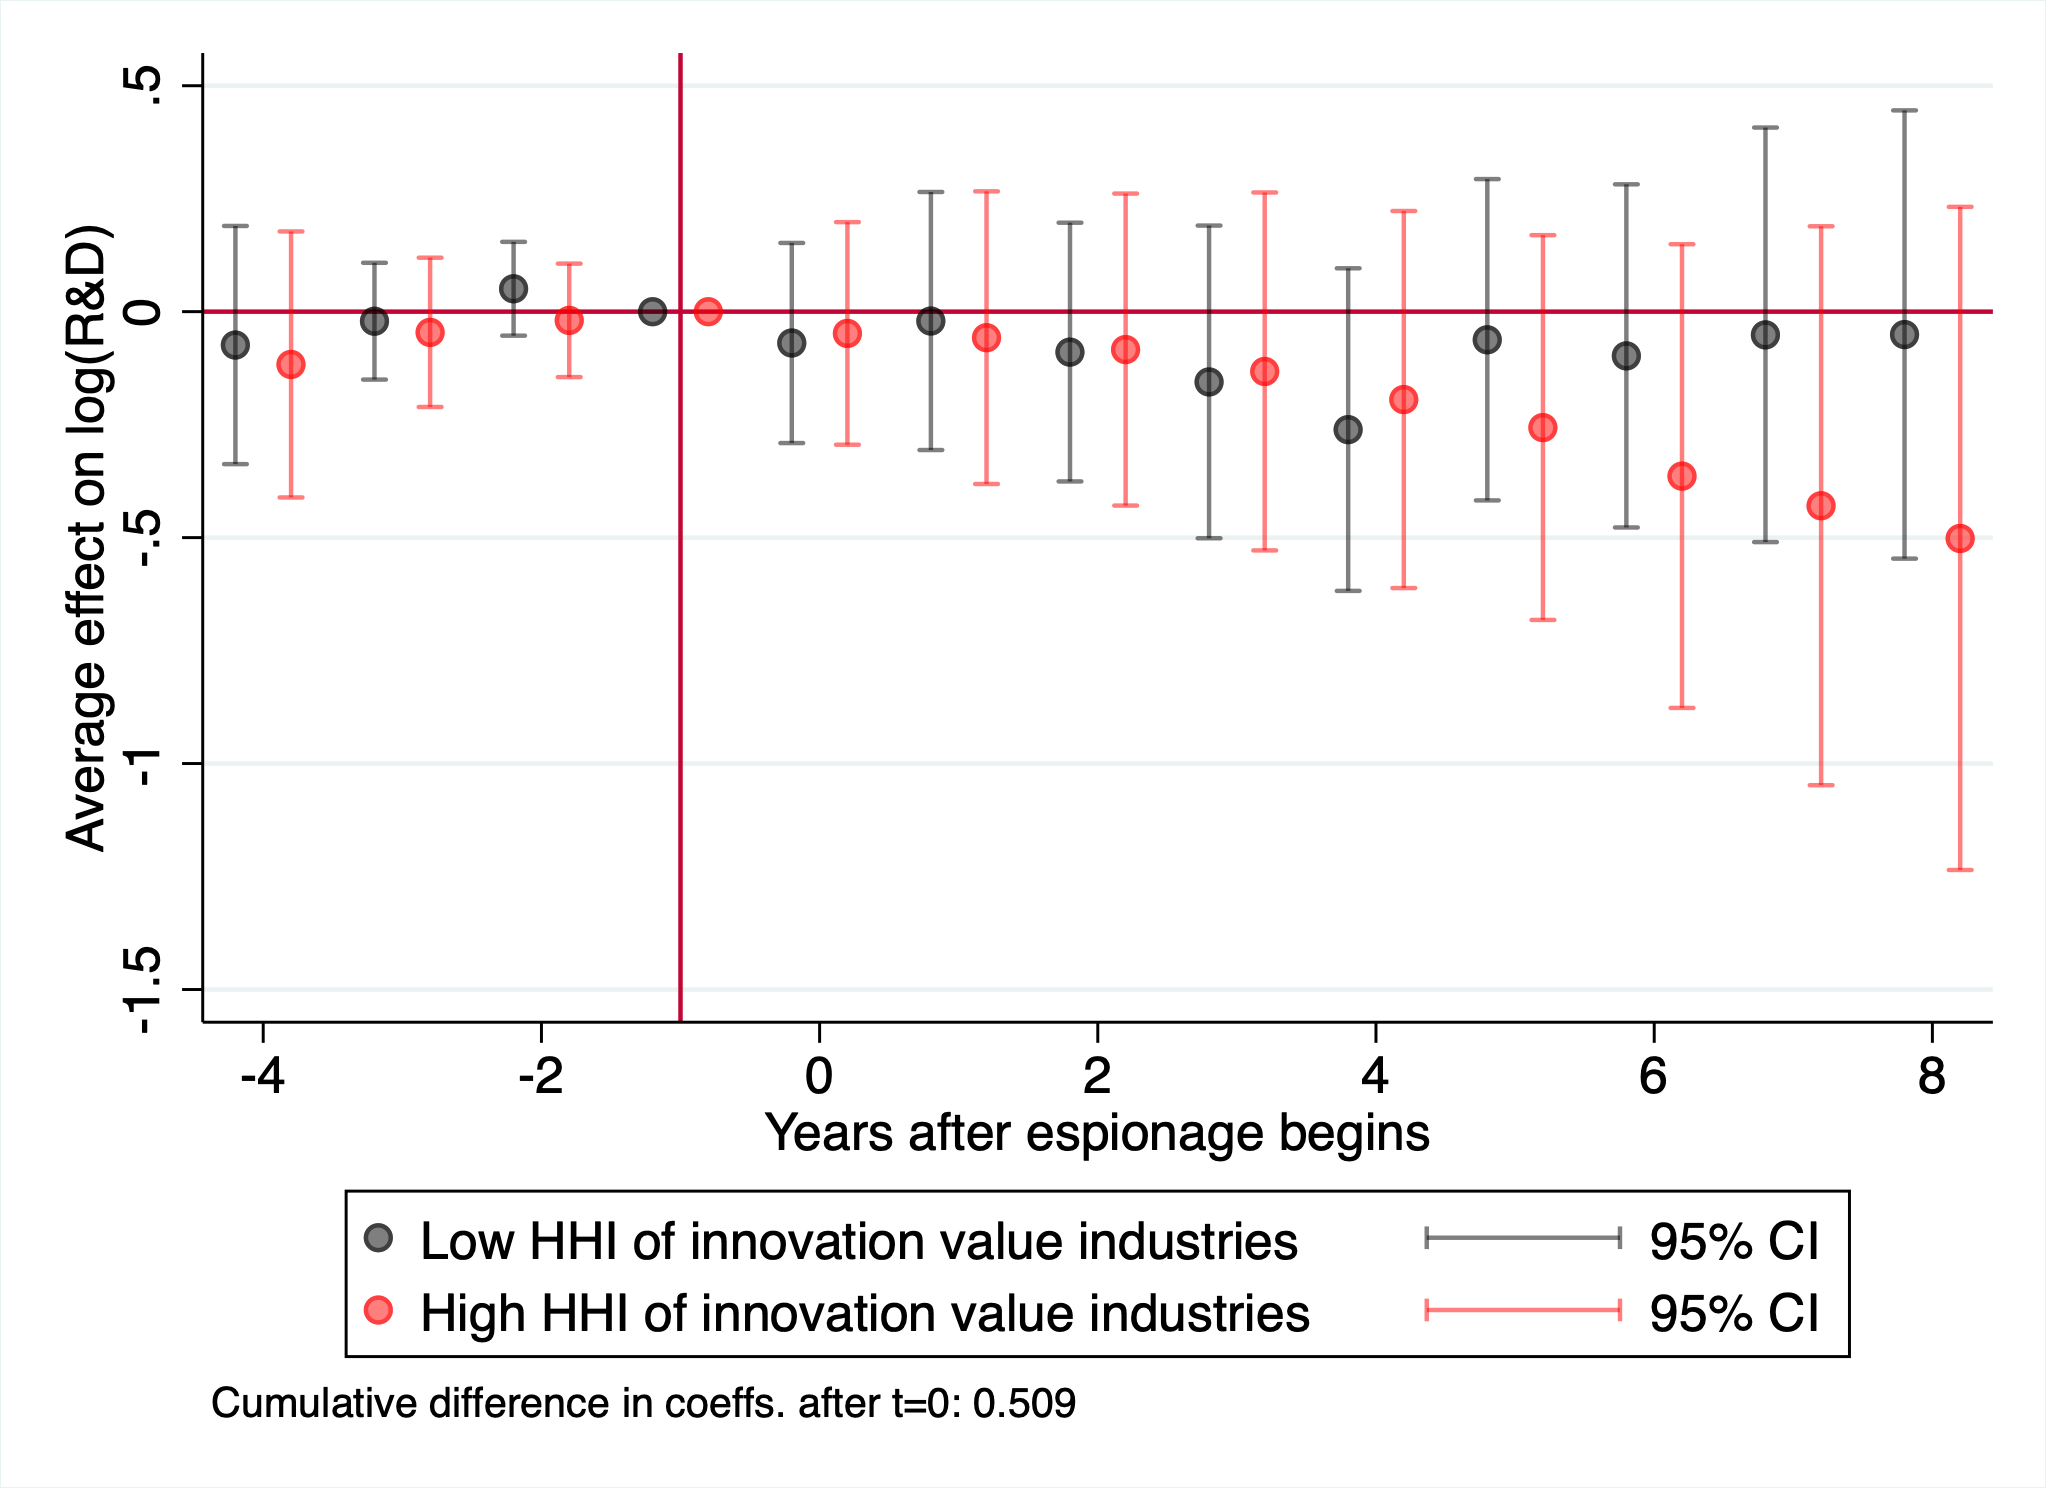
Note: This figure plots heterogeneous effects of espionage incidents. Panel A cuts cases by whether the claimed value of damages in court was above or below the median claimed damage. Panel B cuts cases by whether the targeted industry’s R&D intensity is above or below the median R&D intensity across industries. Panel C cuts cases by whether a targeted industry’s concentration (as measured by HHI) in patent value is above or below the median HHI across industries.
Panel A: Successful cases
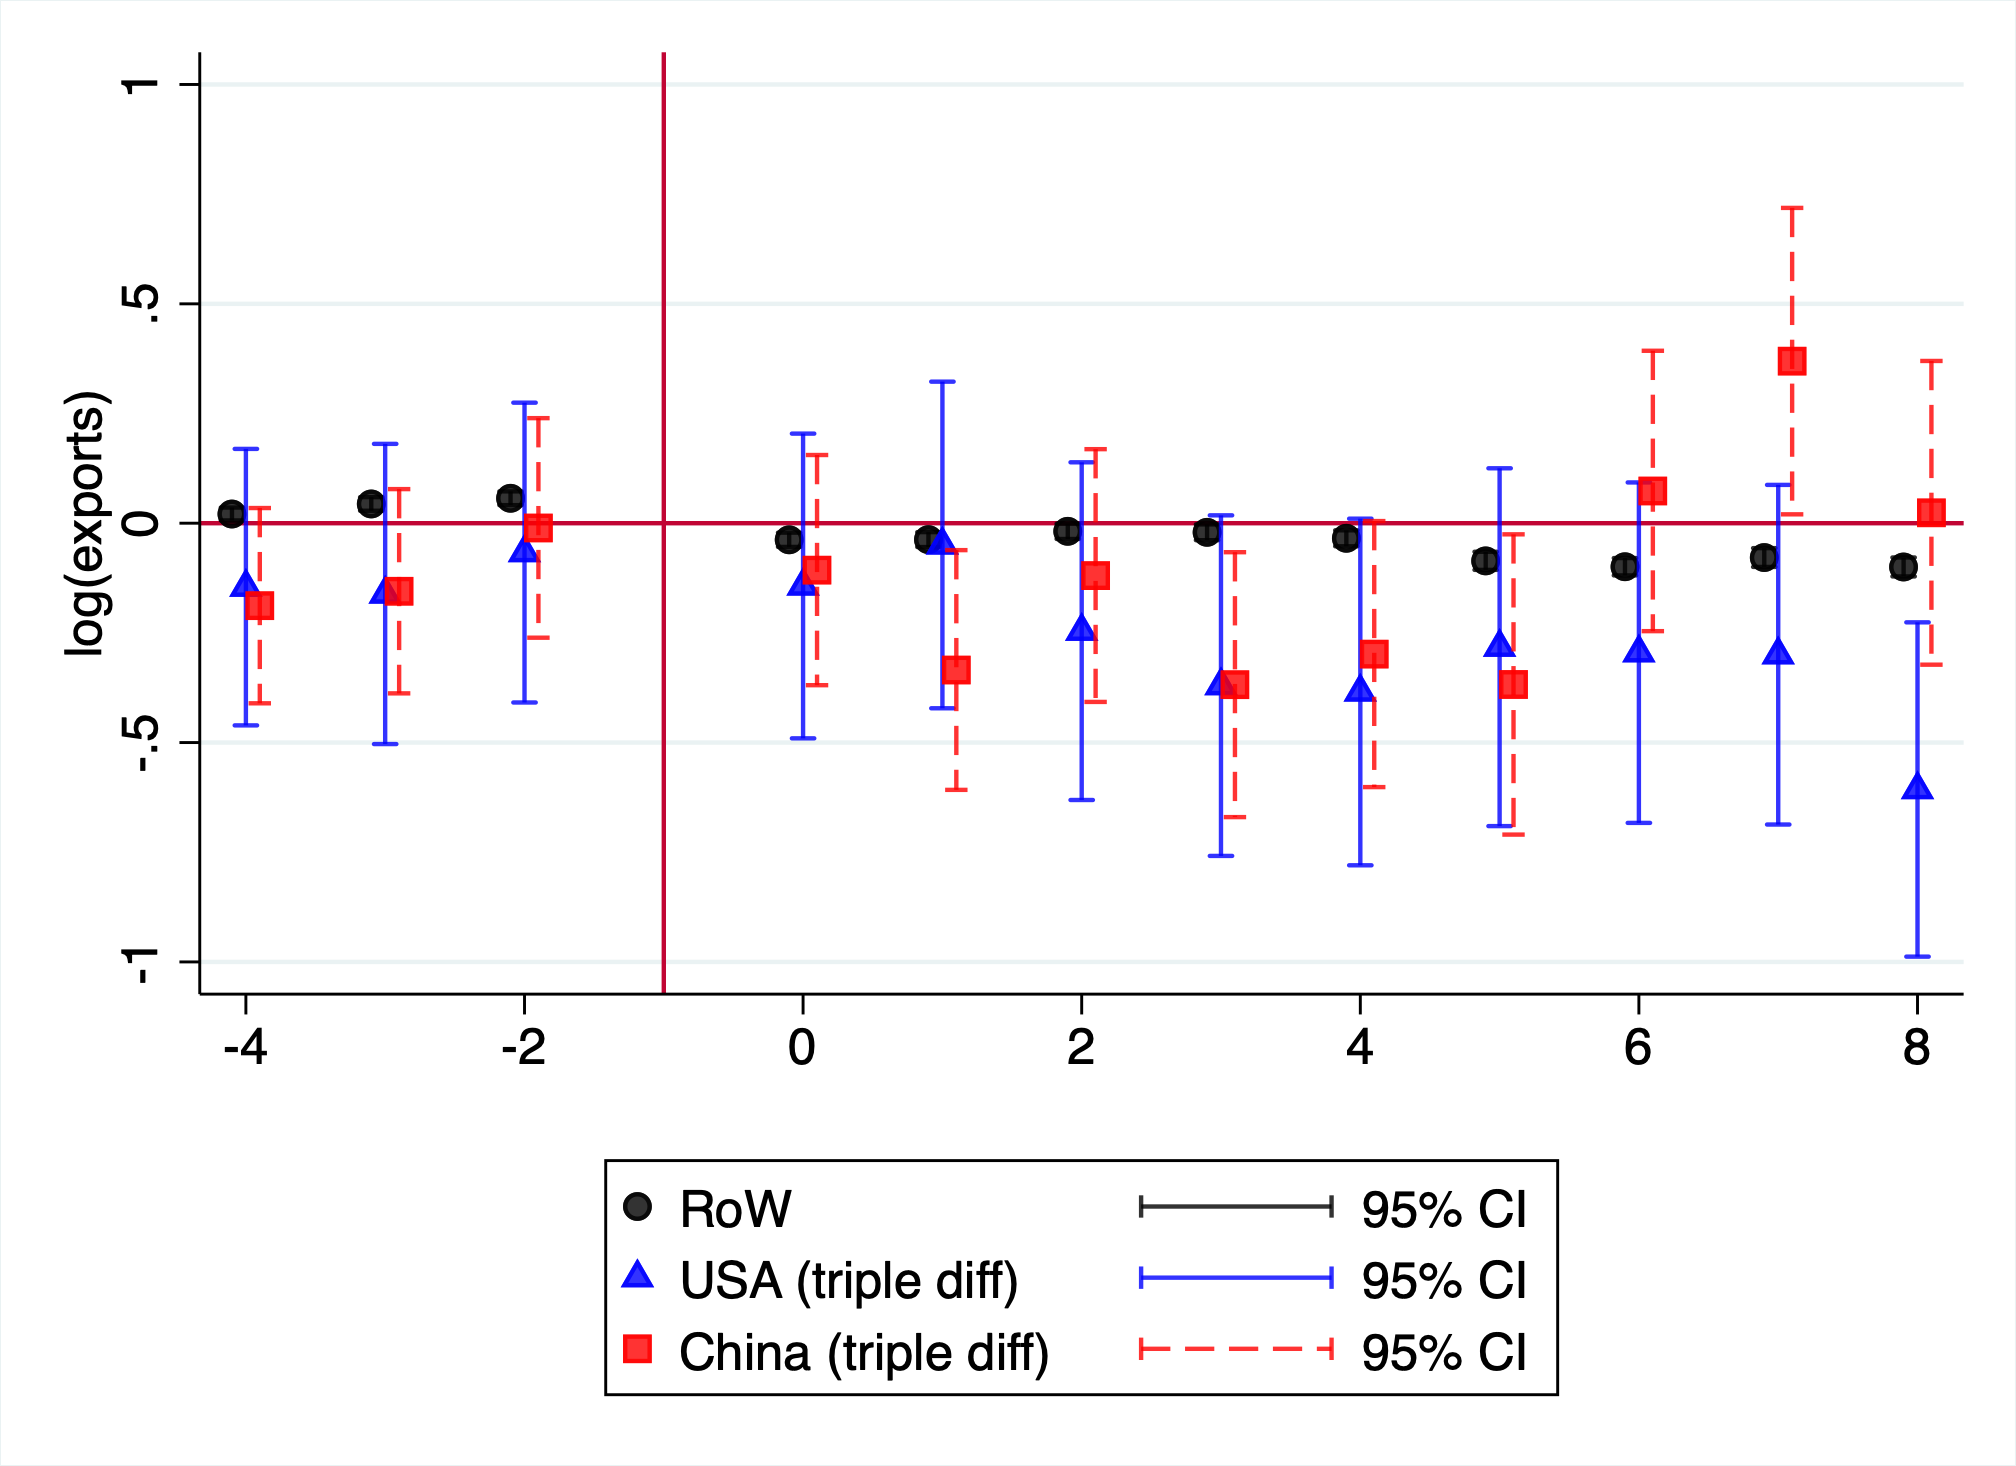
Panel B: Unsuccessful cases
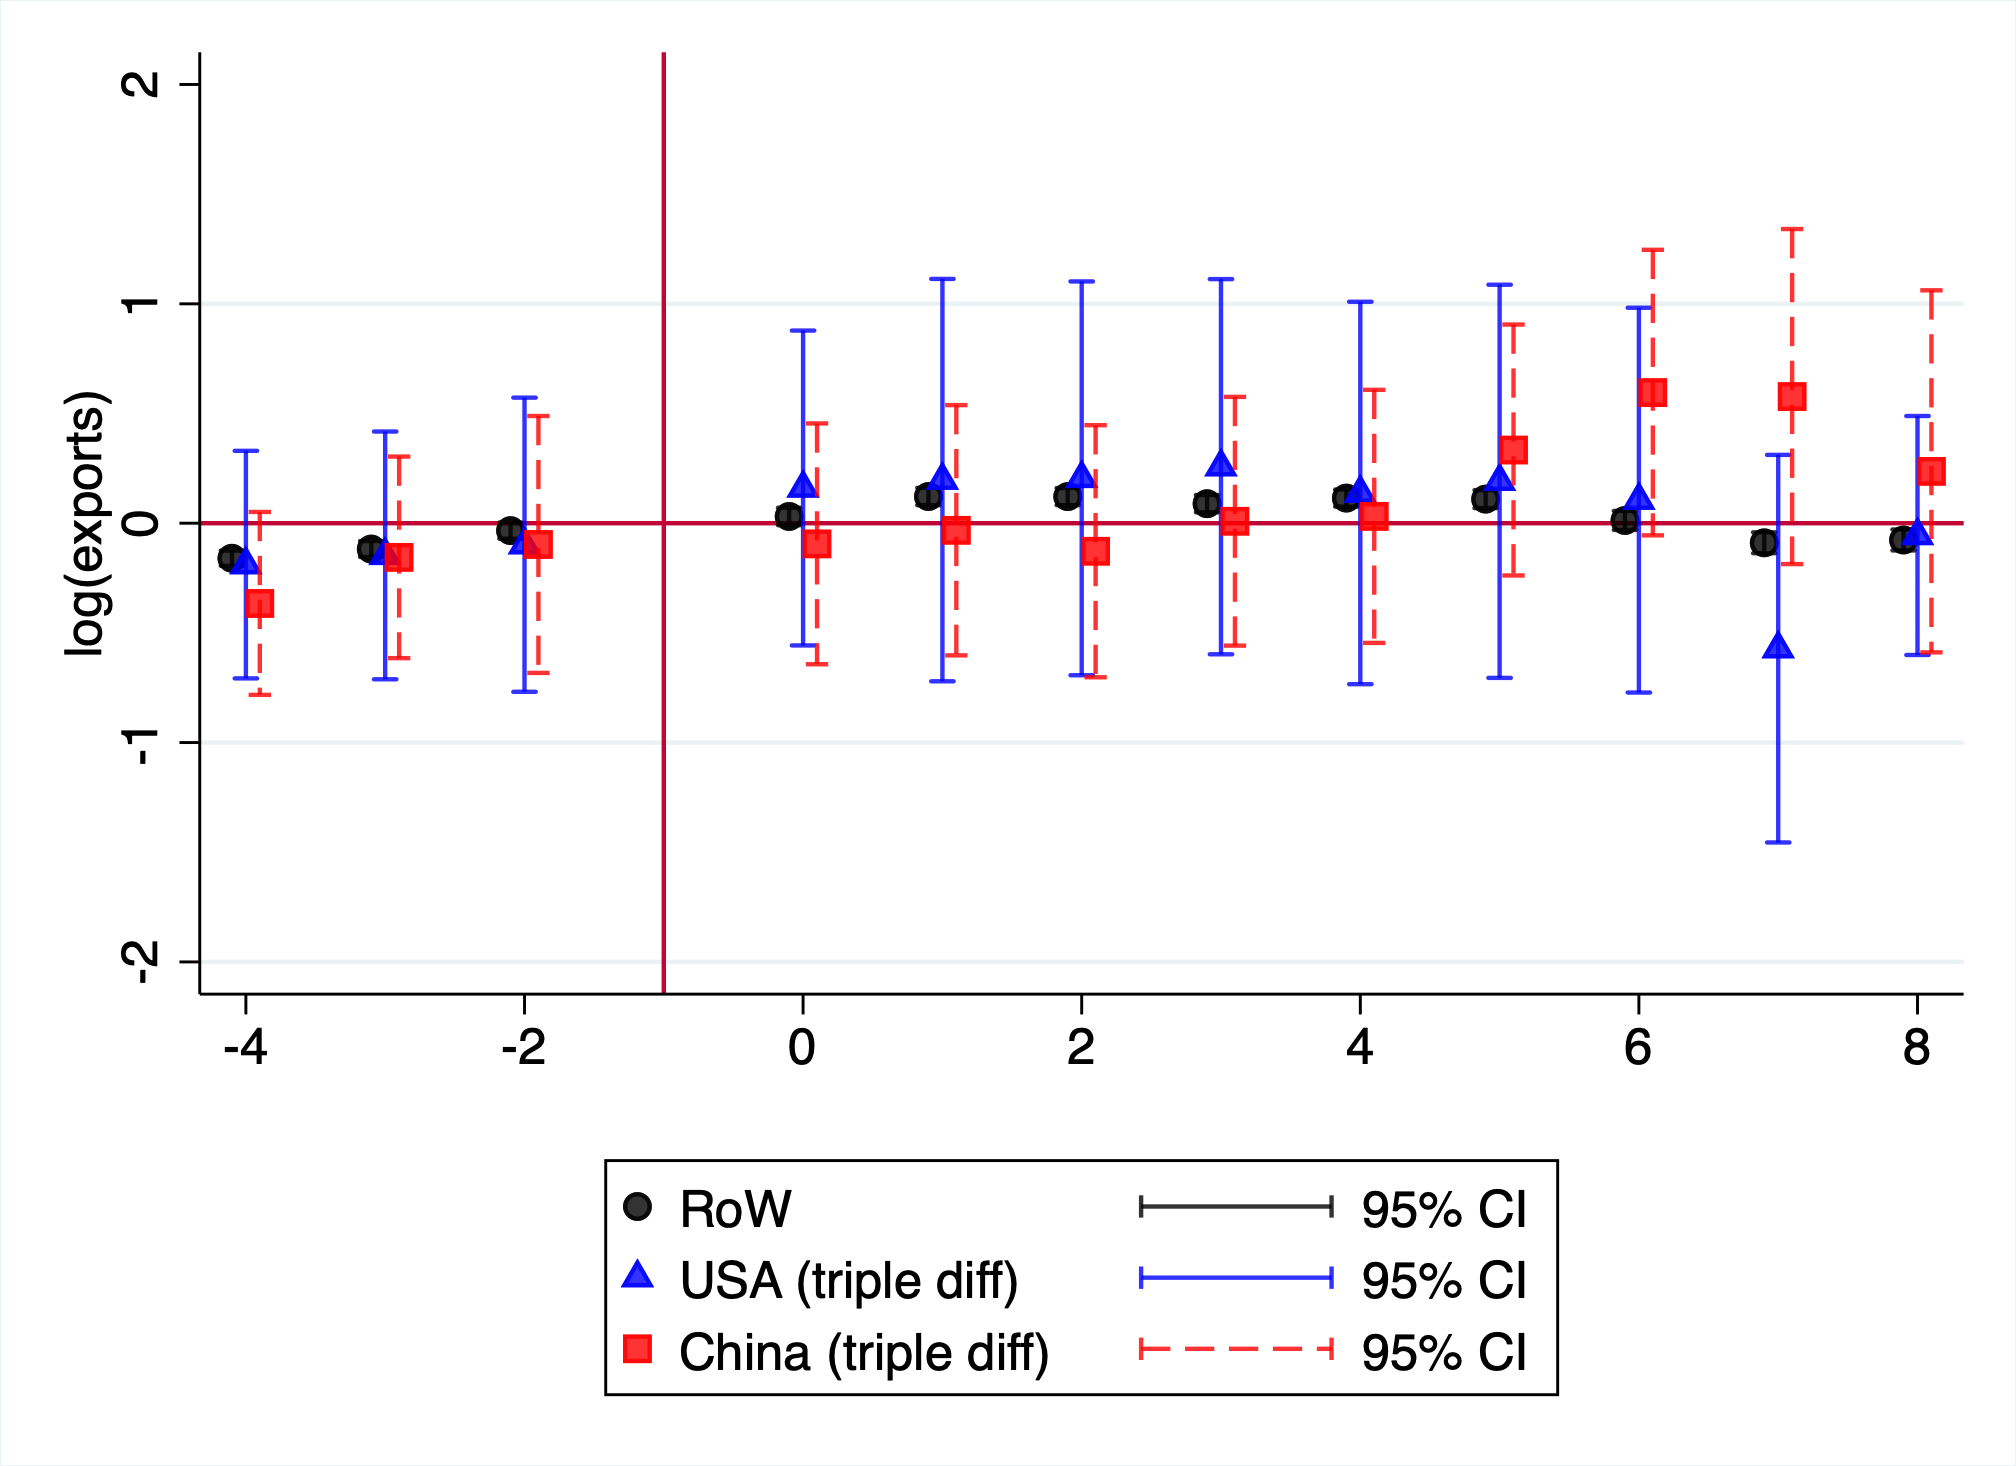
Note: This figure plots coefficients and 95% confidence intervals from a triple differences event study regression at the exporter-year-HS code level. The outcome is the total exports by the exporter in a given year and HS-6 code. The specification includes exporter-year and exporter-HS fixed effects. Coefficients for event-time indicators are plotted in black, while triple difference coefficients for the United States and China are plotted in blue and red respectively. Panel A restricts to successful attempts at espionage, while Panel B restricts to unsuccessful attempts as a placebo test. Standard errors are clustered at the exporter-HS level.
Panel A: Patents per $M R&D Panel B: Patent
inventor in China
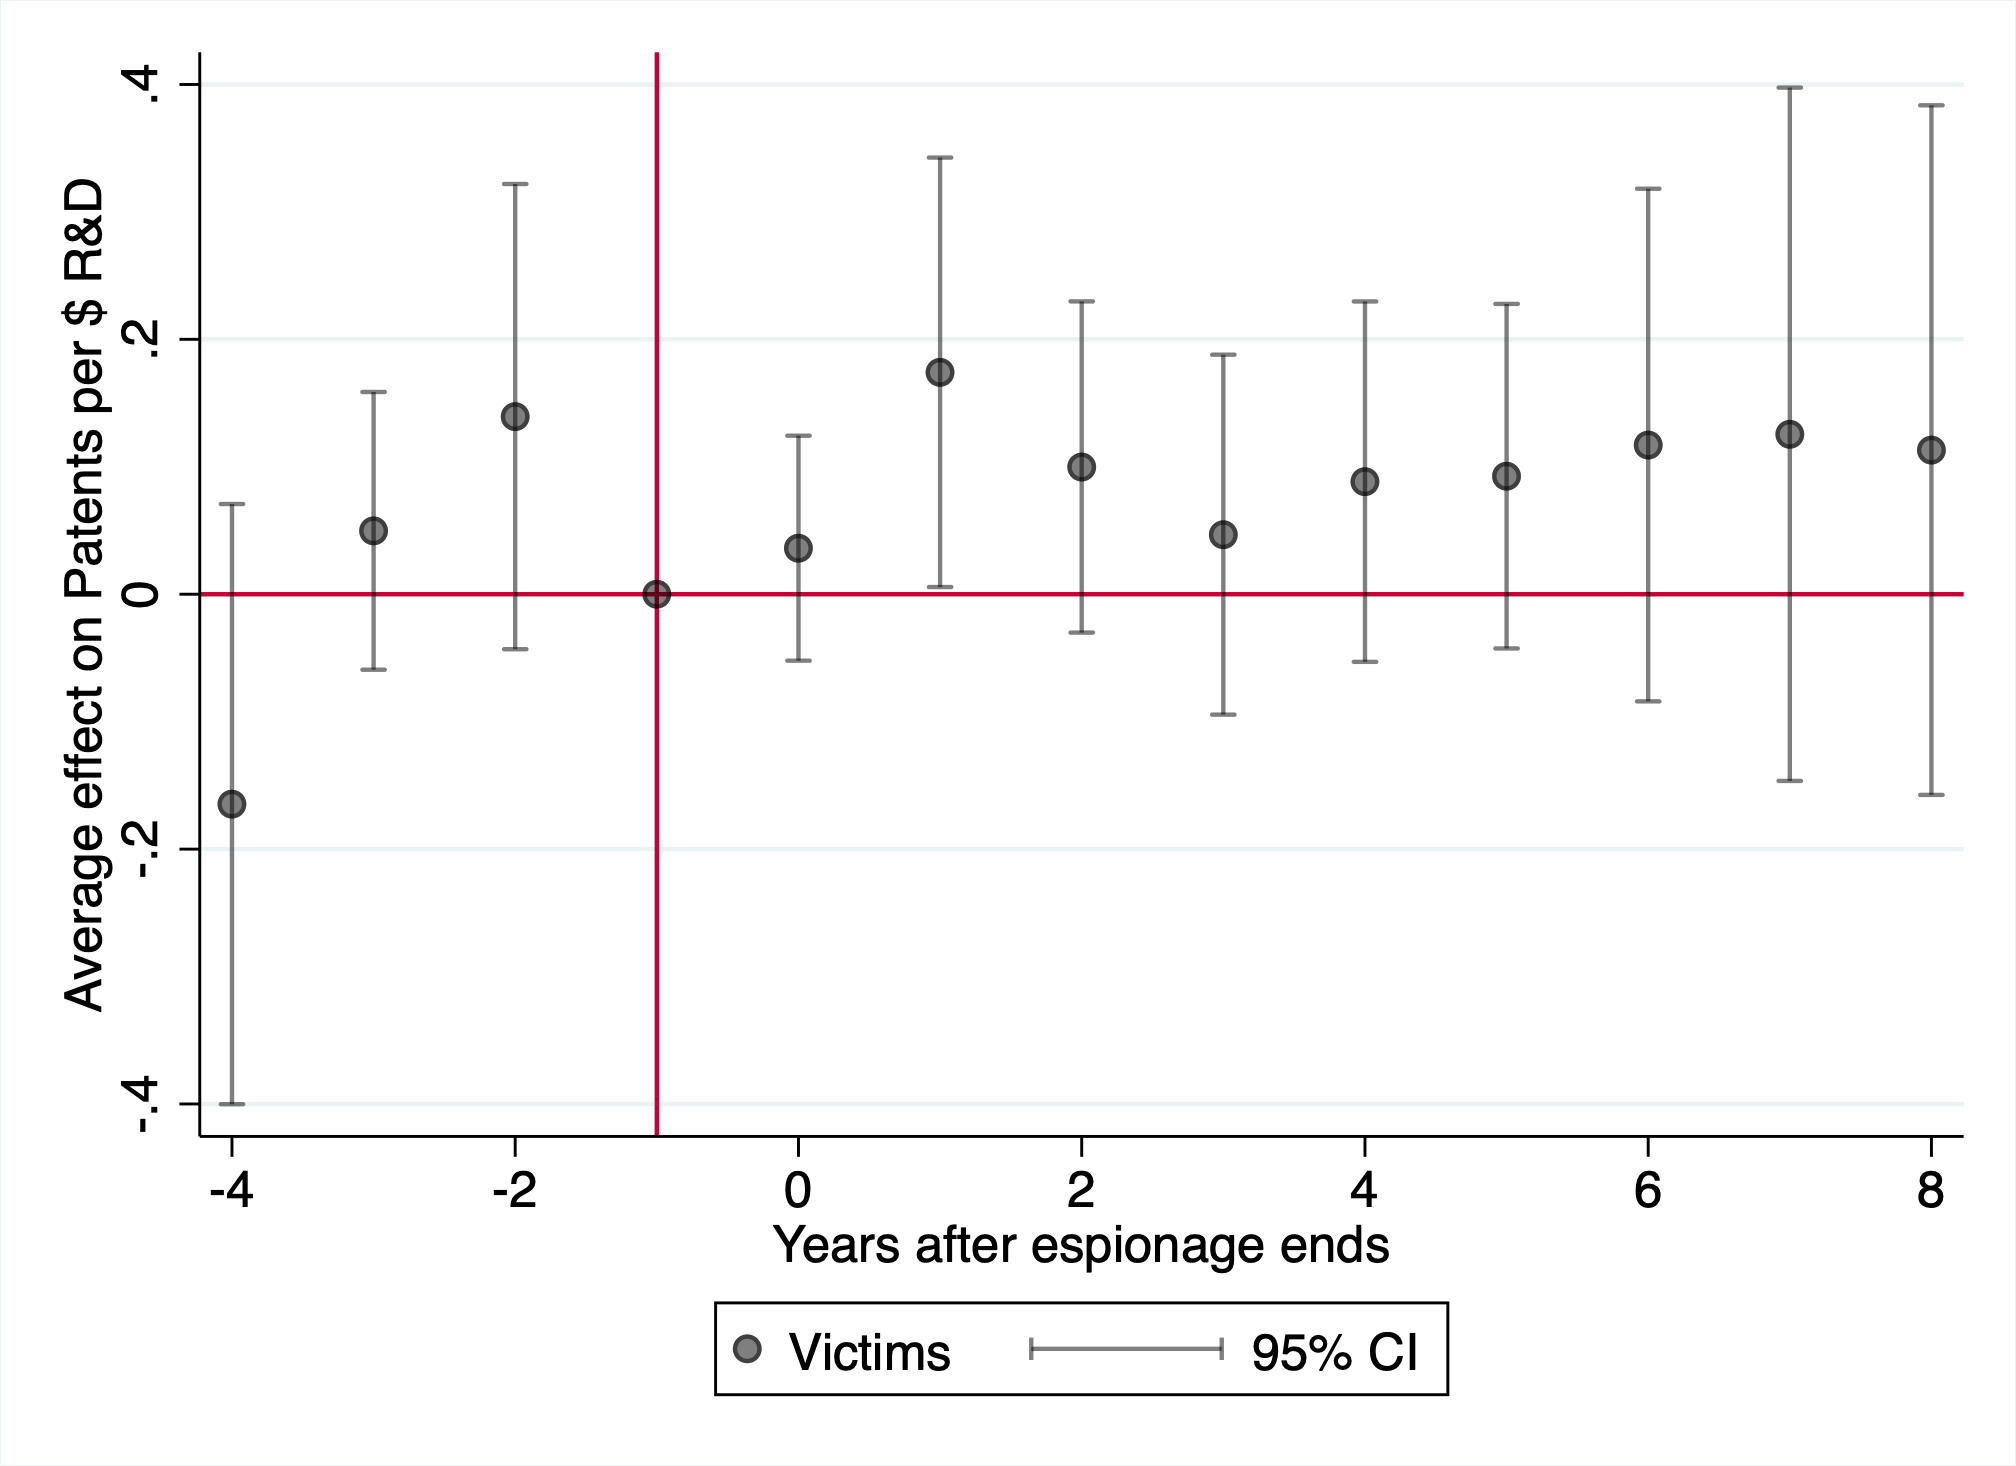
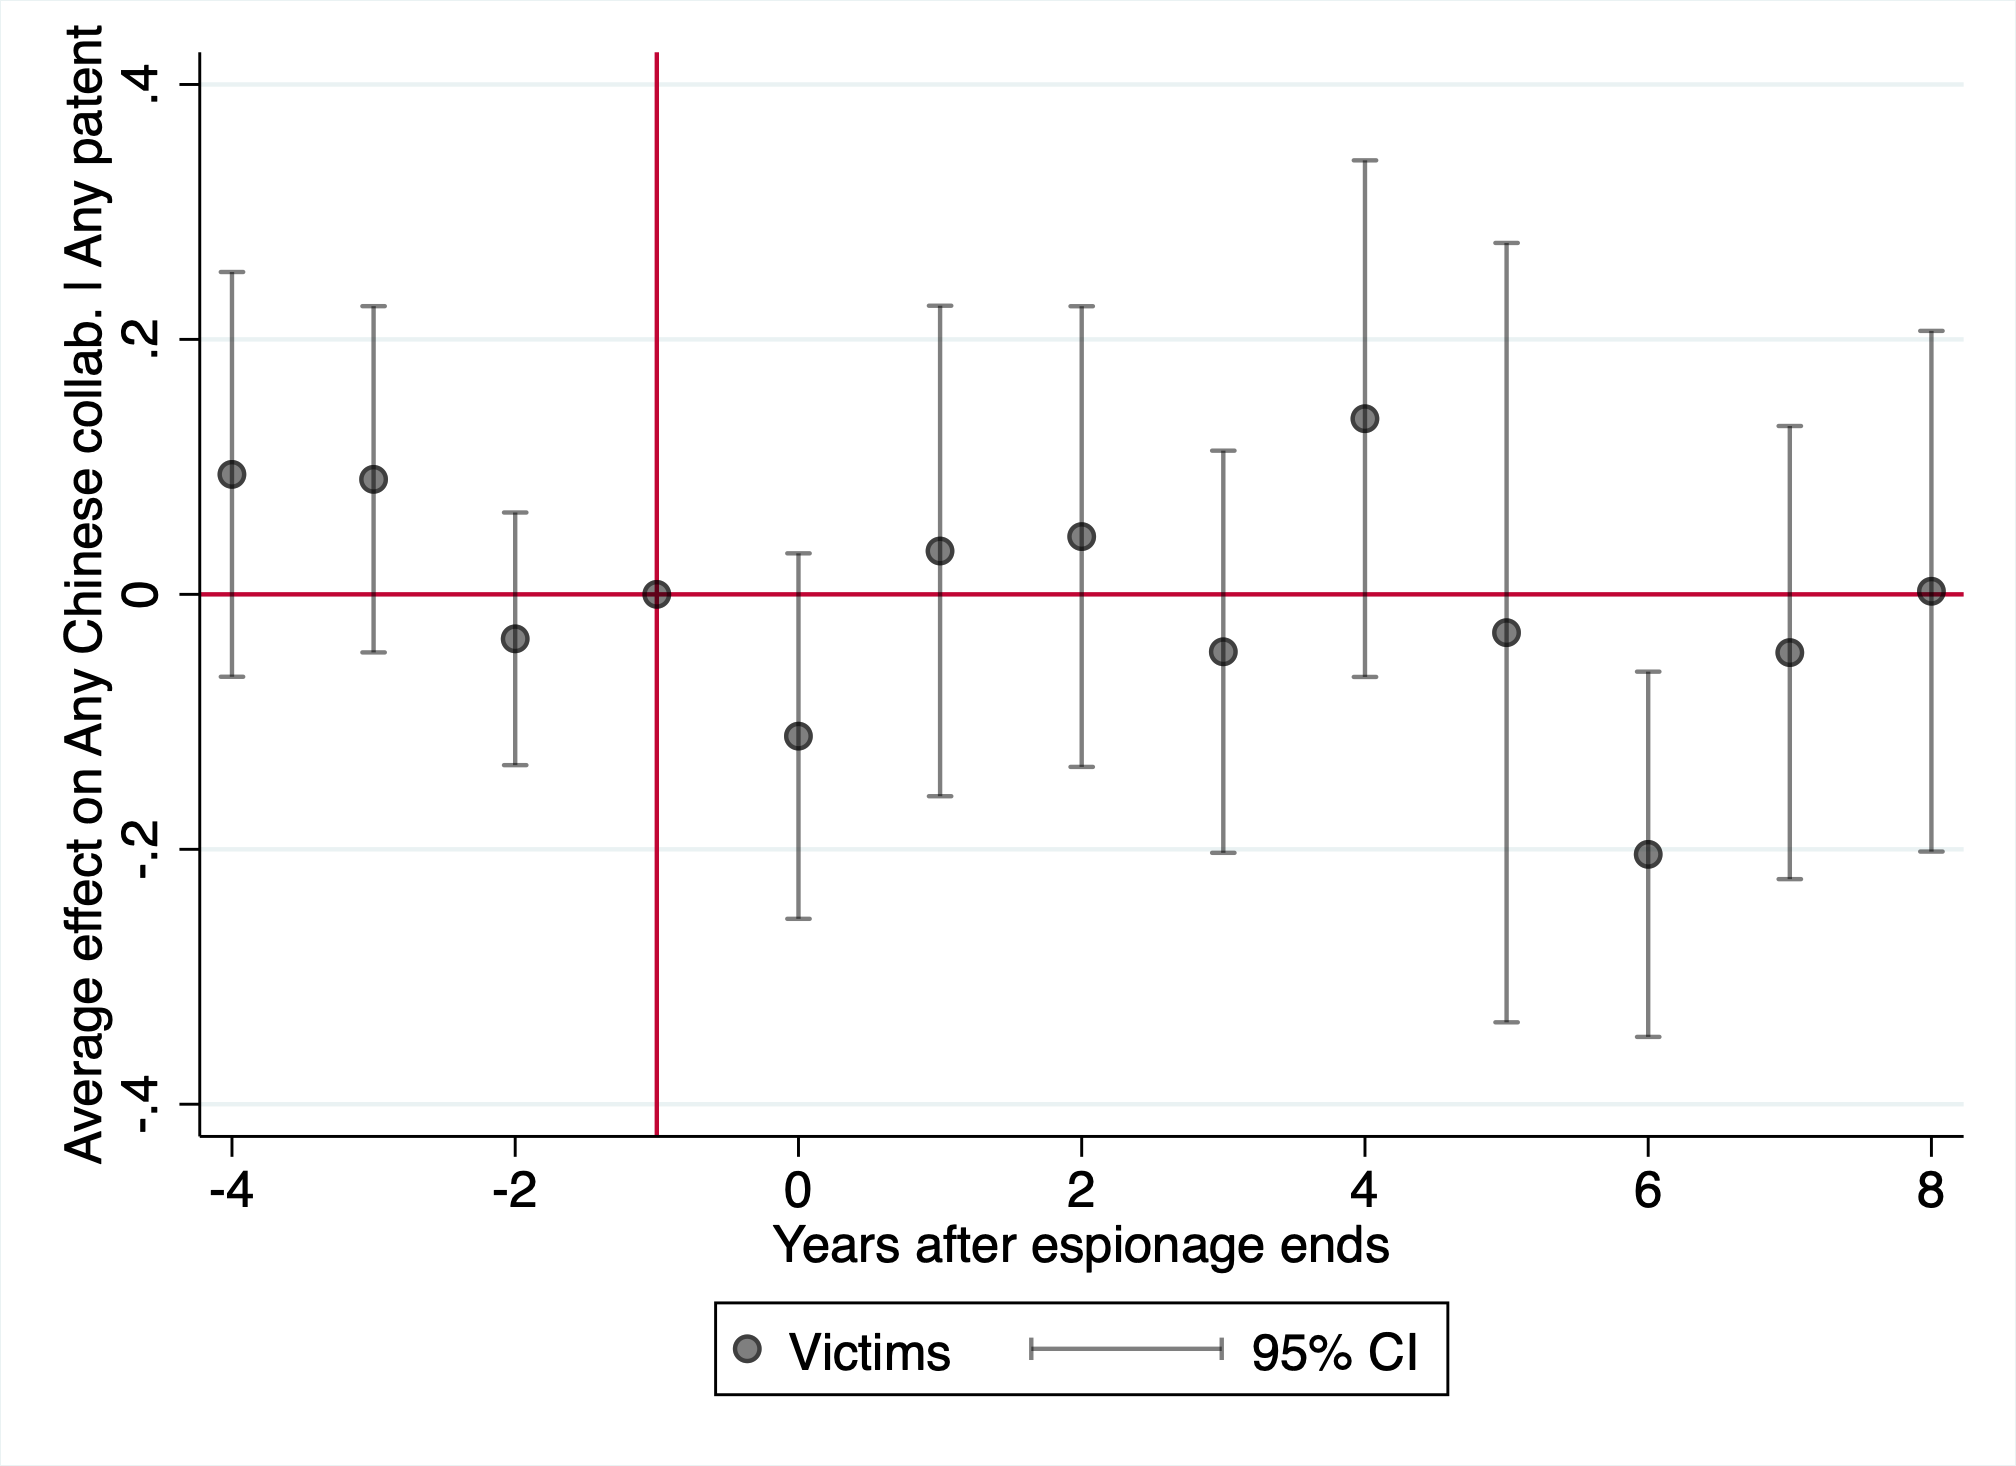
Panel C: China citation share of patents Panel D: Chinese OPTs per
$M revenue
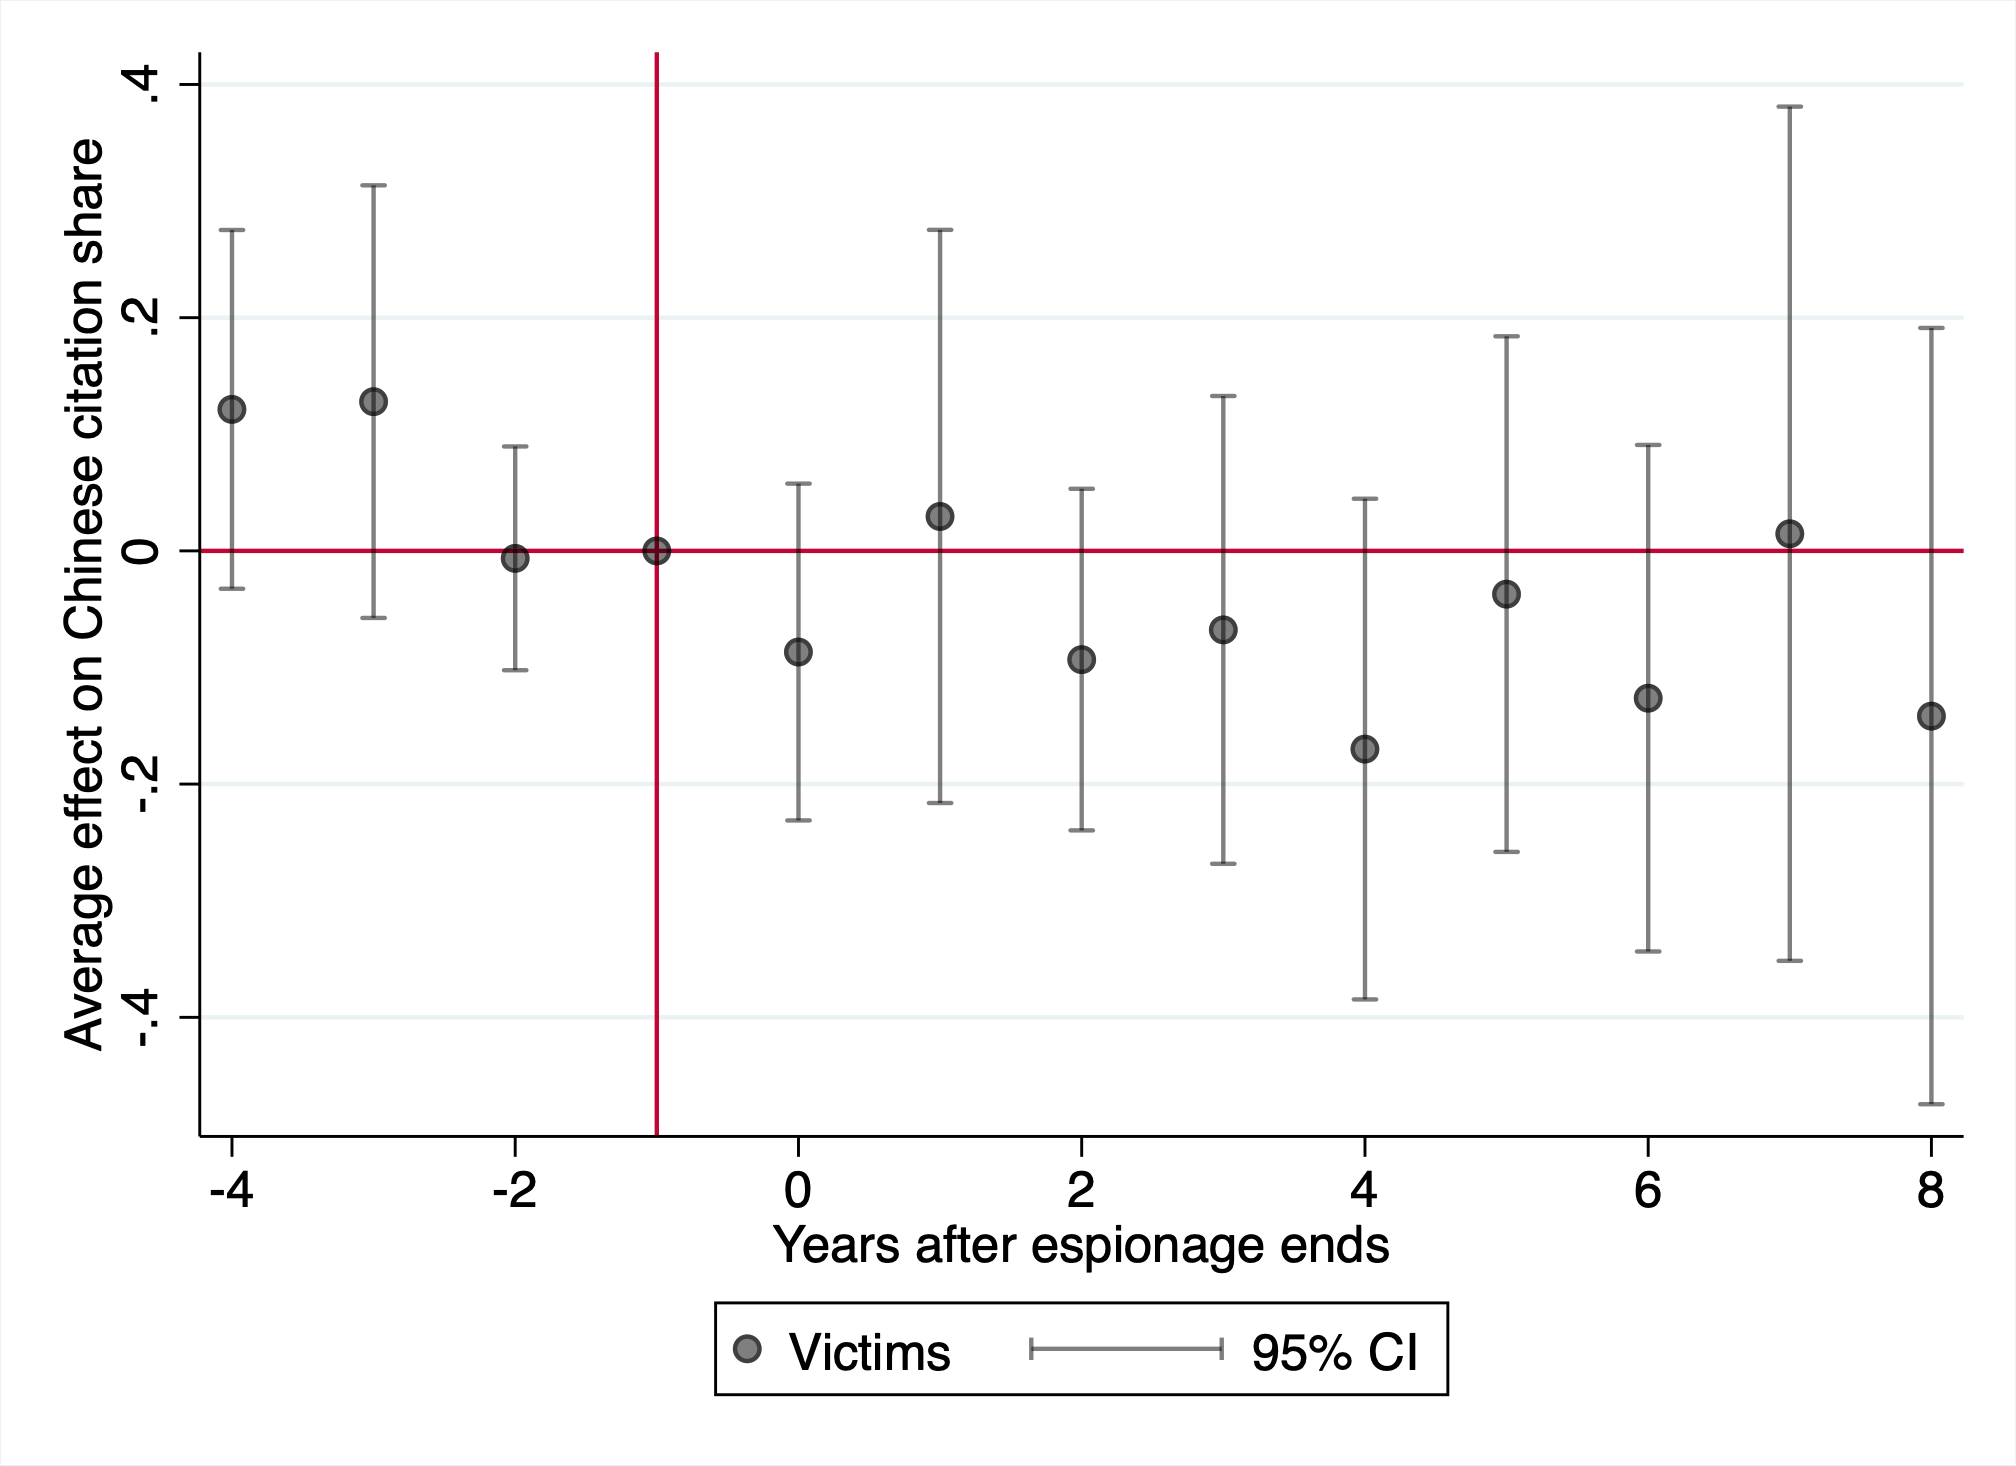
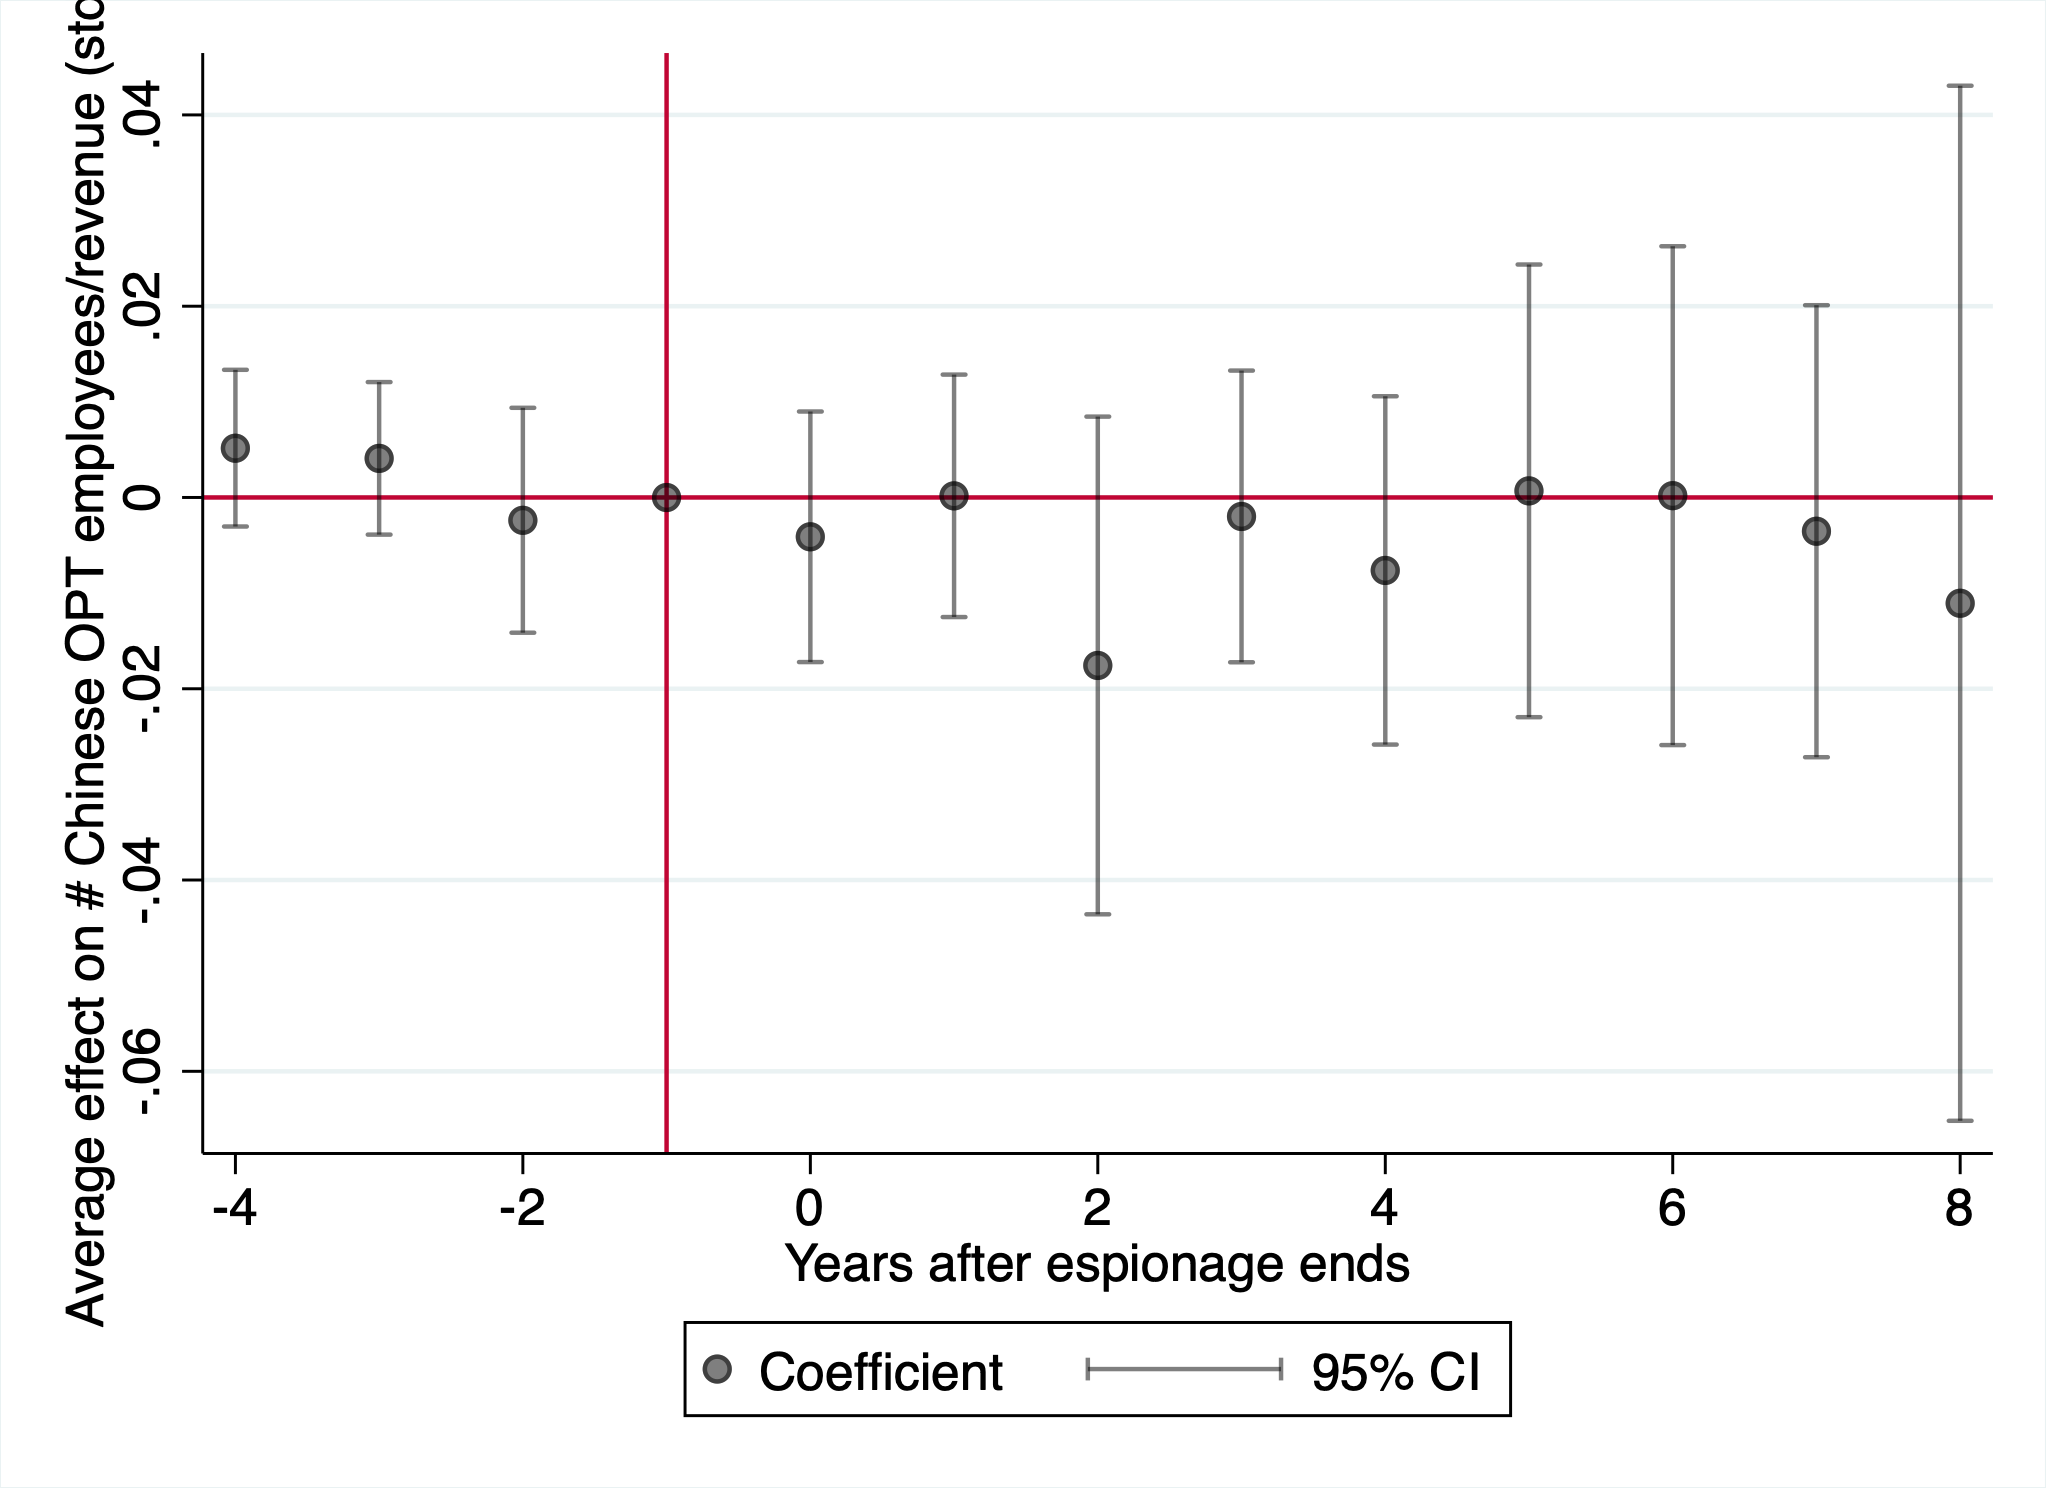
Panel E: log(Geographical markets) Panel F: index
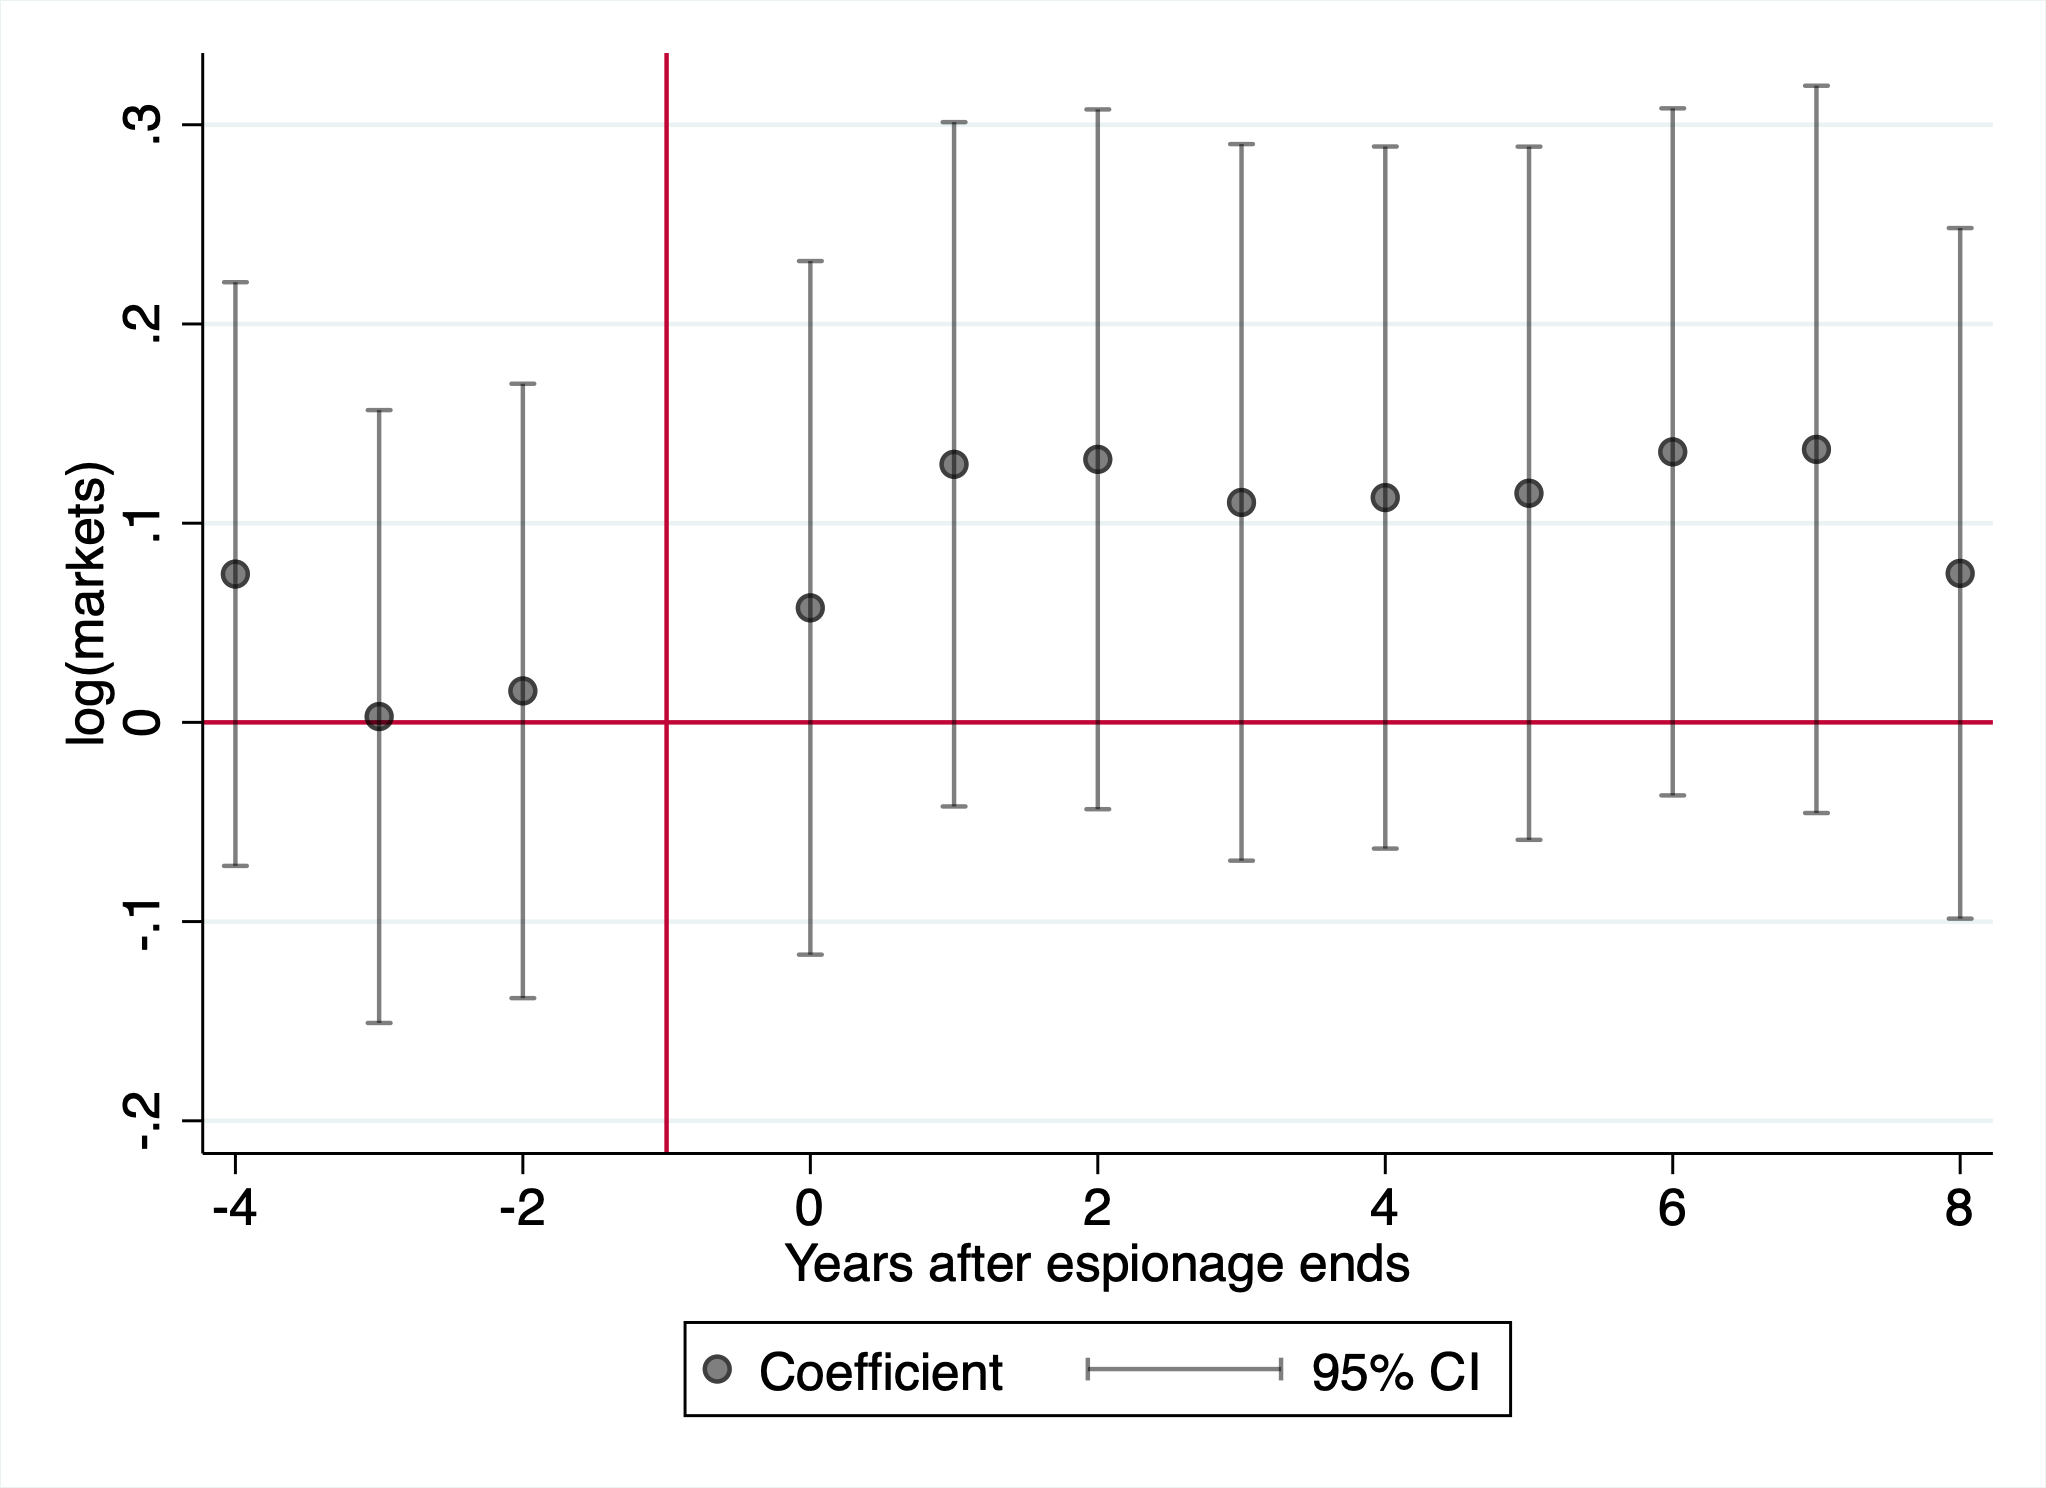
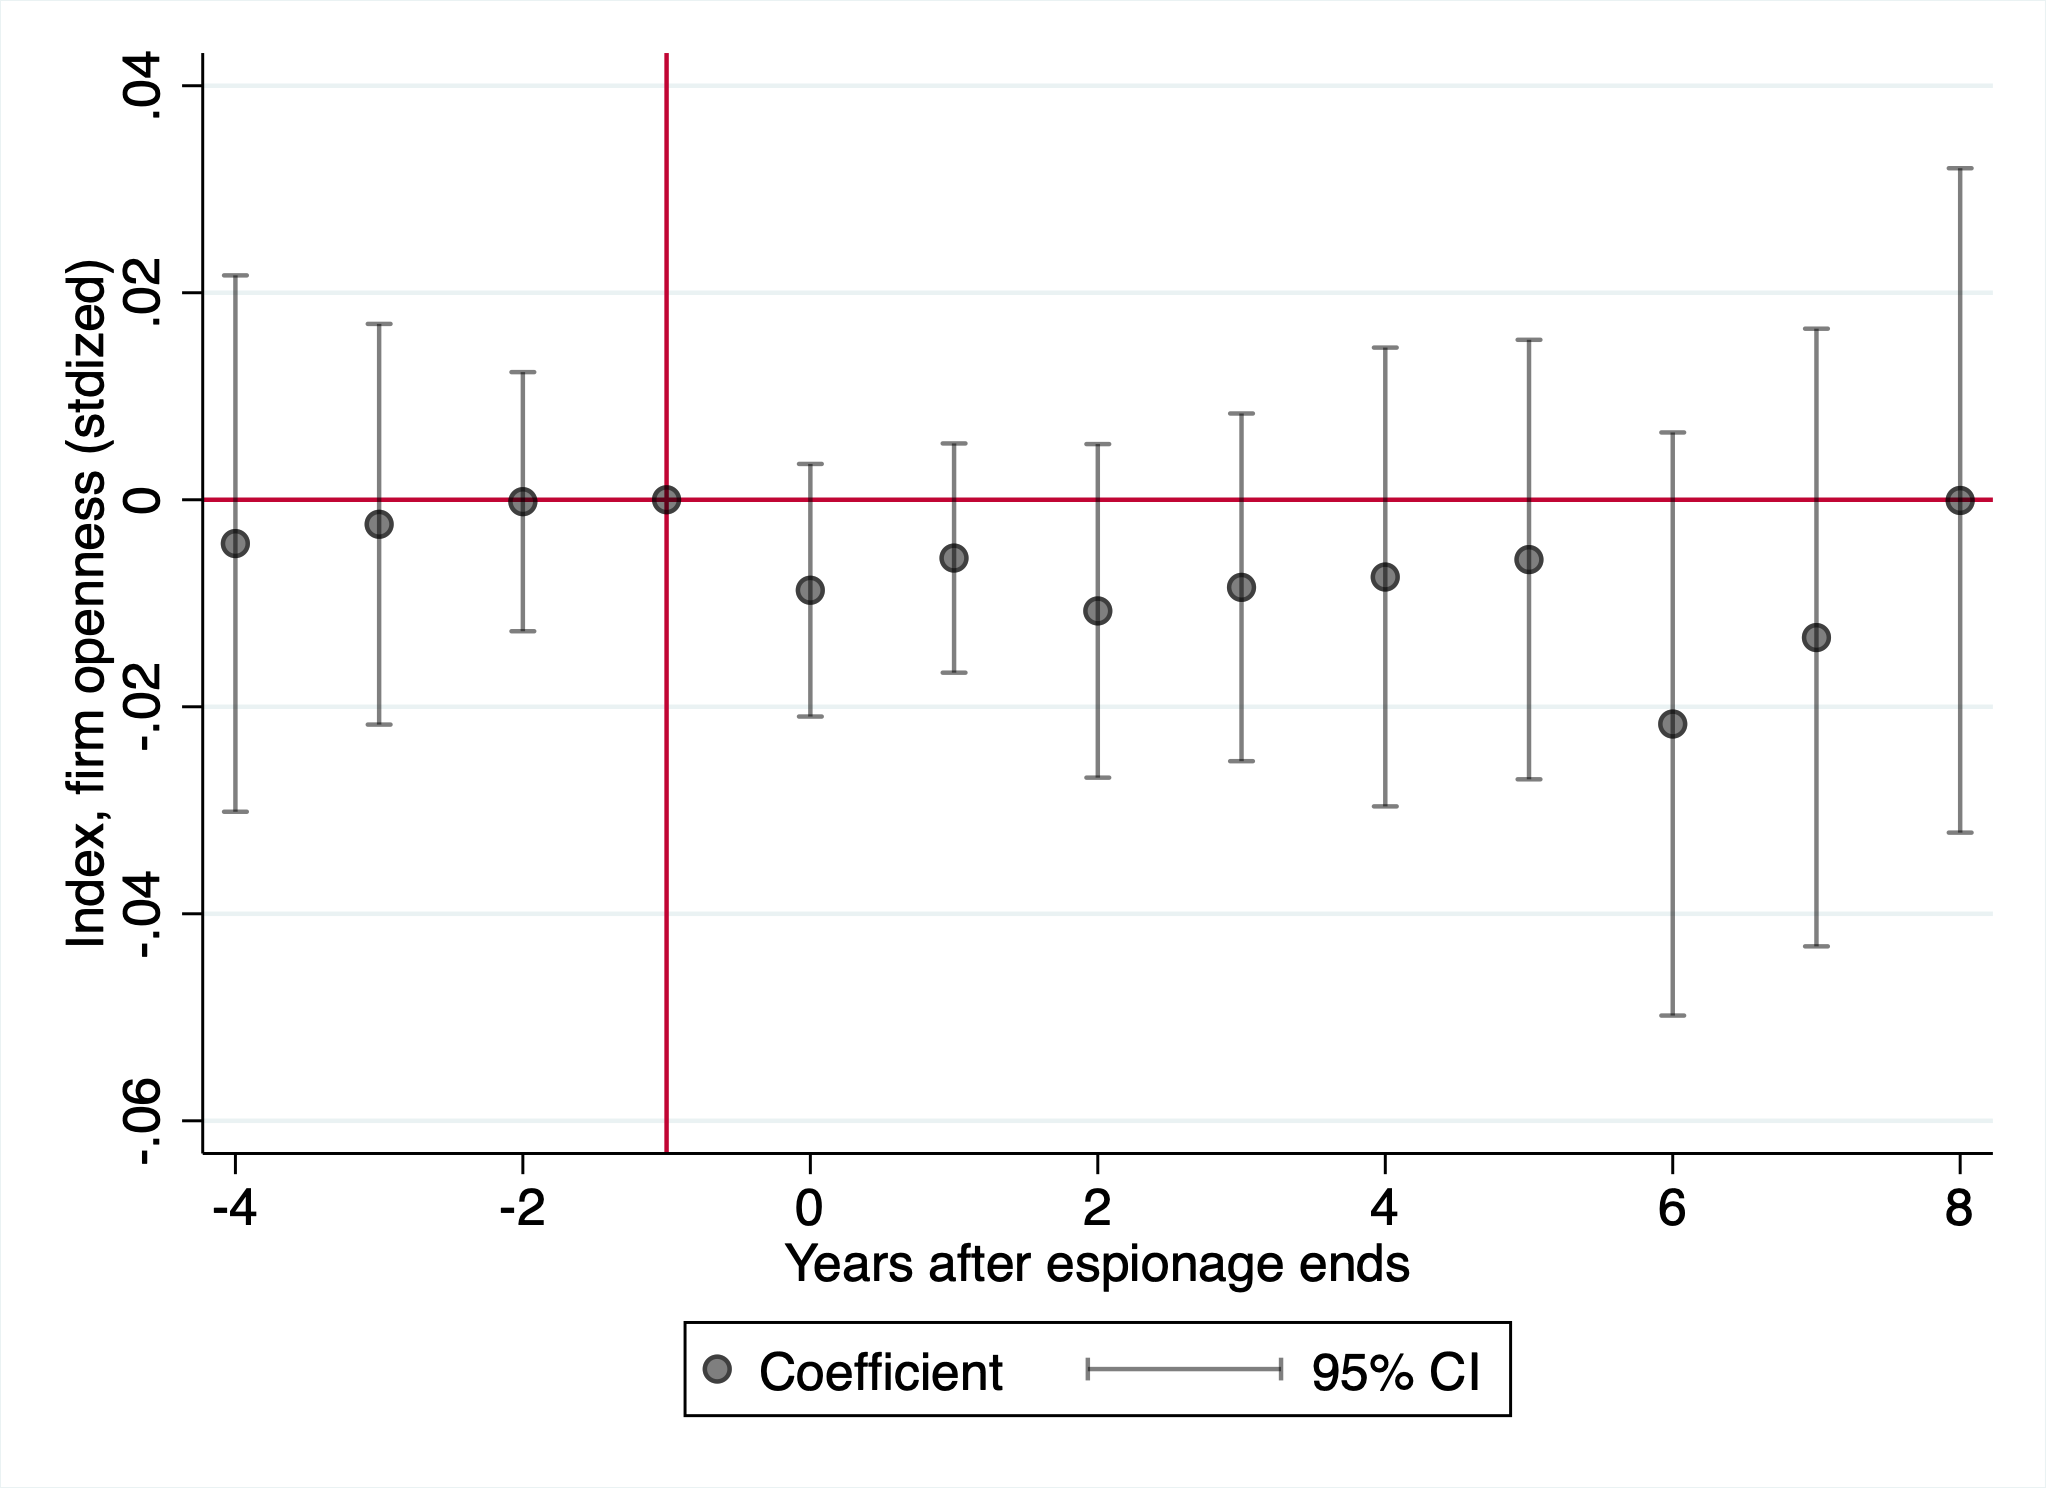
Note: This figure plots coefficients and 95% confidence intervals from two-way fixed effects regressions. An event is when an successful economic espionage incident ends. The outcome in Panel A is patents per million dollars in R&D, Panel B China’s citation share of patents by the firm, Panel C an indicator for collaborating with a Chinese patent inventor (conditional on patenting), Panel D the (standardized) number of Chinese advanced-degree STEM OPT employees per million dollars of revenue, in Panel E the log of the number of geographical markets the company reports being active in, and in Panel F the inverse covariance weighted index of outcomes in Panels A-E. Standard errors are clustered at the firm level.
| SIC | Industry name | Times targeted |
|---|---|---|
| (1) | (2) | (3) |
| 3674 | Semiconductors & Related Devices | 10 |
| 2820 | Plastic Material, Synth Resin/Rubber, Cellulos (No Glass) | 6 |
| 2851 | Paints, Varnishes, Lacquers, Enamels & Allied Prods | 5 |
| 2834 | Pharmaceutical Preparations | 4 |
| 3812 | Search, Detection, Navigation, Guidance, Aeronautical Sys | 4 |
| 3663 | Radio & TV Broadcasting & Communications Equipment | 3 |
| 3711 | Motor Vehicles & Passenger Car Bodies | 3 |
| 7370 | Services—Computer Programming, Data Processing, Etc. | 3 |
| 100 | Agricultural Production—Crops | 2 |
| 1311 | Crude Petroleum & Natural Gas | 2 |
| 2086 | Bottled & Canned Soft Drinks & Carbonated Waters | 2 |
| 2860 | Industrial Organic Chemicals | 2 |
| 2911 | Petroleum Refining | 2 |
| 3721 | Aircraft | 2 |
| 3724 | Aircraft Engines & Engine Parts | 2 |
| 3845 | Electromedical & Electrotherapeutic Apparatus | 2 |
| 4812 | Radiotelephone Communications | 2 |
Note: This table presents captures all sectors targeted more than once. Column 1 presents the SIC-4 code, column 2 a description of the industry, and column 3 the number of times it was targeted for espionage.
| log(Revenue) | log(R&D) | log(Assets) | log(Intangible assets) | |
|---|---|---|---|---|
| (1) | (2) | (3) | (4) | |
| Post espionage X successful | -0.276*** | -0.175 | -0.158* | -0.366** |
| (0.081) | (0.109) | (0.086) | (0.164) | |
| Post espionage X unsuccessful | -0.049 | -0.003 | -0.019 | -0.042 |
| (0.116) | (0.128) | (0.122) | (0.261) | |
| Post X succ. = Post X unsucc., p-value: | 0.0028 | 0.2743 | 0.1820 | 0.0830 |
| Firm FE | Yes | Yes | Yes | Yes |
| Year X SIC FE | Yes | Yes | Yes | Yes |
Notes: This table presents results from a two-way fixed effects regression at the firm-year level. Post espionage is an indicator for years after (and including) the year when a firm has been targeted for espionage. “Successful” is an indicator for firms targeted by an espionage attempt that succeeded, “unsuccessful” an indicator for firms targeted by an espionage attempt that failed. Standard errors are clustered at the firm level. * significant at 10% ** significant at 5% *** significant at 1%.
Online Appendix
This appendix contains additional material, including figures and tables.
7 Data Cleaning
7.1 Scientist Job Classification
Revelio Labs categorizes all LinkedIn job titles into 1500 broad jobs. We manually code jobs as being “scientist” jobs based on their title. Any category whose title contains the word “research” or the word “scientist” is classified as a scientist job (so that, for example, “Senior Scientist” and “Principal Scientist” are captured by the latter rule). Additionally, the following specific categories are also classified as scientists: analytical chemist, automation engineer, CAD designer, CAD engineer, chemical engineer, chemist, clinical research, electrical design engineer, electrical engineering, environmental engineer, environmental scientist, geotechnical engineer, hardware design engineer, hardware engineer, industrial designer, industrial engineer, industrial engineering, innovation, lab, lab tech, lab technician, laboratory, laboratory analyst, laboratory technician, materials engineer, mechanical design engineer, mechanical designer, process developer, process development, process development engineer, process engineer, process engineering, product design, product design engineer, product designer, product developer, product development, product development engineer, product engineer, product engineering, R&D, R&D engineer, R&D project, and scientific.
7.2 Employee Reviews on Diversity and Inclusion
RevelioLabs provides individual review data for many of the companies in our sample. These reviews include both an individual’s overall rating of the company, and also the individual’s rating of the company on diversity and inclusion. Additionally, the full text of the employee’s review is also recorded.25 While coverage of the overall ratings and the text of employee reviews range from 2008 to 2025, the diversity and inclusion reviews only begin in 2020. This poses a substantial sample restriction.
To overcome this restriction, we make use of the text of the reviews and natural language processing techniques to impute diversity and inclusion ratings. This allows us to extend coverage of these ratings back to 2008.26 We conduct this imputation in two separate ways: TF-IDF and ridge regression, and a fine-tuned BERT model. Heuristically, the TF-IDF and ridge regression method identifies words that are highly predictive of the ratings and uses a penalized regression on these words to estimate the final rating, while the fine-tuned BERT model involves tuning a language transformer model to our particular text corpus to predict the final rating. We describe each method in more detail.
7.2.0.1 TF-IDF and Ridge Regression:
We vectorize our training set (data from 2020 onwards) corpus using TF-IDF (term frequency-inverse document frequency). When conducting TF-IDF, we first convert all words to lower case and remove accents. To build the vocabulary of terms, we include both unigrams and bigrams, filter out any terms appearing in over 95% of ratings as stop-words as well as any terms that appear in less than 5 ratings. We also limit the vocabulary to contain a maximum of 300,000 terms. Finally, instead of using the raw term frequency, we use \(1+\log(\)term frequency) (sublinear scaling) to smooth the distribution.
With the training set vectorized using TF-IDF, we then run a ridge regression on the diversity and inclusion ratings using \(\lambda = 1\) (where \(\lambda\) is the constant on the L2 regularization term). This allows us to fit the model on the training data. To complete the imputation for the full dataset, we vectorize the full dataset and apply the fitted ridge regression model to it.
7.2.0.2 Fine-tuned BERT model:
We begin by splitting the data into 5 folds (with an equal number of
companies per fold), splitting the training/test set based on these
folds. We next tokenize the text, and use as our baseline model a
multilingual BERT (Bidirectional Encoder Representations for
Transformers) model fine-tuned for consumer sentiment,
nlptown/bert-base-multilingual-uncased-sentiment We further
fine-tune the model on our own data with a regression head to predict
the diversity and inclusion rating. To do so, we use the optimizer AdamW
with a learning rate of 2e-5, 3 epochs, and a batch size of 8 for both
training and evaluation.27 With the model
fine-tuned, we generate predictions for the diversity and inclusion
ratings on the full dataset.
On a five point rating scale, we achieve a MAE (mean absolute error) of 0.659 using TF-IDF and ridge regression, and a MAE of 0.728 using the fine-tuned BERT model.
For robustness, we conduct an imputation of the overall ratings using the same methods as the diversity and inclusion ratings. We achieve a MAE of 0.491 using TF-IDF and ridge regression and a MAE of 0.507 using the fine-tuned BERT model. Event study results using overall ratings as the outcome are highly similar regardless of whether we use the actual overall ratings, or the imputed ratings from either method.
7.3 Automated Discoveries from Earnings Calls
Do firms communicate in systematically different ways following successful espionage incidents on earnings calls? We use the method in (Carlson 2026) to simultaneously test over 16,000 hypotheses. This method is designed to be automated, minimizing researcher degrees of freedom, while allowing for a very large number of hypotheses to be tested. It also appropriately statistically controls for false discovery rates. Beneath, we summarize the method (including a difference-in-difference extension we develop for our setting), and then discuss technical implementation details.
7.3.0.1 Method
We begin with the text data of earnings calls from US public companies that are ever targeted for espionage (successfully or unsuccessfully). This text data is passed through a large language model (LLM) equipped with a pretrained sparse autoencoder (SAE). The sparse autoencoder contains approximately 16,000 features, designed to span the underlying concepts that a LLM uses in a human interpretable way. Examples of activations may be substantive (e.g., “references to scientific authors or collaborators, particularly in the context of publications or citations ”, “terms related to emergency medical services and their operations ”, “materials or methods related to chemical analysis and spectrometry”.) or stylistic (e.g., “numerical values related to sizes or dimensions”, “language constructs related to functions and their definitions in code ”). At this stage, the data are a large matrix \(Y\) where rows \(i\) correspond to a unique earnings call and columns \(j\) SAE features, with cells \(Y_{ij}\) a binary indicator of a particular concept being expressed in that earnings call.
(Carlson 2026) constructs a test statistic for differences in means between two groups. We extend it to our differences-in-differences setting, constructing the test statistic as follows: \[T_{f,j} = \frac{1}{\sqrt n} \sum_f \frac{W_f - \pi}{\pi(1-\pi)} \frac{1}{|F|}\sum_{i \in F} [D_{ft(i)} Y_{ij} - (1-D_{ft(i)})Y_{ij}]\] where \(f\) indexes a firm, \(F\) the set of calls corresponding to firm \(f\), \(n\) the number of rows of \(Y\), \(W_{f}\) an indicator for treatment (1 for successful espionage, 0 for unsuccessful), \(\pi\) the proportion of treated firms, and \(D_{ft(i)} = 1\) if the call is post-espionage attempt and 0 otherwise. This applies a Horvitz-Thompson transformation after differencing out any within firm fixed characteristics. This also differences out any secular changes in language between pre- and post-treatment periods. An important note is that in this analysis, the untreated group is defined as the firms that were unsuccessfully targeted for espionage—not firms that were never targeted for espionage, as in our main analysis.
All features are then simultaneously tested using the high-dimensional multiple hypothesis testing procedure described in (Carlson 2026). This is a bootstrap procedure that produces a critical value for each feature while controlling the k-familywise error rate. Thus, from this procedure we identify (1) features that are statistically different across successful and unsuccessfully targeted firms (before and after treatment), (2) point estimates for how much more frequently these features are used, and (3) confidence intervals for each feature.
7.3.0.2 Implementation
We begin by truncating each document to the first 16000 characters (avg. 3325 tokens).28 We use as our LLM/SAE Gemma Scope 2B.29 Human interpretable descriptions for each of the roughly 16,000 features are obtained from Neuronpedia.30
After constructing the test statistics, we obtain critical values and confidence intervals using the bootstrap procedure with \(k=5\) (for the \(k-\)familywise error rate), \(\alpha =0.05\), and 100,000 bootstrap draws. The critical value is \(T=3.909\). Across 16,350 features, we reject the null (treatment effect is 0) for 2 features: feature 16223 (‘patterns of formatting changes or markup language elements’, \(T=4.190\)) and feature 4836 (‘the word "while" in various contexts’, \(T=4.054\)).
7.3.0.3 Case study
We find less than a dozen direct references to “economic espionage” in the relevant text corpus. Of these, roughly a third concern the case of AMSC (introduced in Section 2). After news of the espionage broke, the company held several calls to discuss how the company would adapt to this development. We excerpt relevant portions of these calls and discuss how they relate to our findings.
The CEO, in his opening statement, noted:
We have made important changes that we believe will return AMSC to long-term growth and sustainable profits. I intend to provide much greater detail on the specifics in our next call, but let me touch on just a few highlights. We have lowered our headcount by 30%, streamlined our management team and reduced our cost structure by $30 million annually since the start of the fiscal year. We have instituted new, conservative financial controls, which include the requirement for letters of credit or bank guarantees before shipments to China.
The headline changes constituting a reduction in headcounts is consistent with our findings of reduced revenues and employment in Sections 4 and 5.2.
When discussing how they would adapt to the espionage incident, executives noted that:
The actions of Sinovel are not a referendum on China wind or China in general. We have, and will continue to have, many valued relationships in China. We remain strongly committed to Chinese wind customers, like Dongfang, XJ Group, Shenyang Blower Works and JCNE. It is an economic reality that we must do business in China and I believe we can do it securely and profitably.
This corroborates the lack of adaptation across geographical markets that we find in Section 5.3.
When directly questioned on how they would adapt given the possibility of IP theft by an analyst, the firm responded:
At a high level, if you recall as we described on the previous call, there were very few people that have access to the information and today, they are even fewer people that have access to information within the Company. We set up additional IT controls to also monitor and be able to control information that we feel that we had a very strong system to start with. We had very limited exposure. And now we believe that we have additionally limited that exposure. From a protection standpoint, it is clear that outright theft had to occur to be able to get around our product level protections. When we look at the control systems for the partners that we have that pay and our partners that respect intellectual property, we have gotten clear signals from them that they are committed to working with us to be able to utilize current technology as well as new technology going forward.
From these authors’ subjective reading of the case, this may be considered a light-touch response to espionage, unlikely to influence the fundamental openness of the firm’s innovation and technology, and also unlikely to reverse the damage done by espionage.
8 Additional Analysis
8.1 Effects on Targeted Firms
8.1.0.1 Robustness Checks
Recent work has emphasized that two-way fixed effects event study estimators can be biased in settings with staggered treatment timing and heterogeneous treatment effects. We therefore re-estimate Equation 1 using five alternative estimators: Callaway and Sant’Anna (2021), Borusyak et al. (2024), Chaisemartin et al. (2024), Sun and Abraham (2021), and Gardner (2022). In Figure 9, we plot dynamic treatment effects from each estimator and find results are not sensitive to the choice of estimator. This is natural in our setting: because most firms in our data are never treated, most of the identifying comparisons are between ever-treated and never-treated firms, which TWFE and recent estimators handle similarly. We report only the TWFE estimates for the rest of the paper.
8.1.0.2 Secondary Outcomes
While revenues and R&D expenditures are flow quantities, one can also test whether their stock analogues, total assets and intangible assets, are affected by espionage. In Figure 10, Panels A and B, we find that economic espionage has a negative effect on a firm’s total assets and intangible assets. We once again find a lack of pre-trends, and find that their path follows a similar pattern to revenues and R&D, declining by 30% (assets) and 60% (intangible assets) within 4 years of espionage beginning, with effects persisting in the 4 years that follow. However, in Panels C and D, we find noisy null effects on gross/net profit margins, consistent with the interpretation that these firms are declining in scale, but not experiencing changes in mark-ups.
Using operating segment data from Compustat, we can also decompose these changes in firm revenues into differences by exports and domestic sales to see where firms are most affected by espionage. In Figure 12, we show that domestic sales and exports to China both drop following economic espionage incidents. Five years after espionage, domestic sales and exports to China have fallen by 60%; exports to markets other than China are noisier.
8.1.0.3 Spillovers within Targeted Industries
What happens to other firms in an industry when one of them is targeted for espionage? This could be an identification concern with Equation 1. To address this question, we estimate a triple difference specification using Equation 4, in Figure 11. Overall, we find no evidence of either positive or negative spillovers to other firms within the same SIC 4-digit code.31
8.1.0.4 Effects on Stock Returns
To measure effects on firms that might not be captured by the balance sheet data, we examine the stock market response to espionage. To do this, we estimate each firm’s cumulative abnormal returns at various time horizons using Fama-French factors.32
Figure 13 displays these effects, for two definitions of treatment—when espionage begins (Panel A.1), and when espionage is announced (Panel A.2) We find that the declines in firm valuations also track the declines in firm fundamentals, with a roughly 20 to 30% drop in firm value two years after espionage begins. We interpret the initial drop in a firm’s valuation as the market reacting to a fundamental decline in firm value due to espionage—most of the time, the public does not know that an espionage incident has occurred until after the 2 year window displayed.33 The announcement of an espionage incident is associated with a further 20% penalty to firm valuation in the 2 years afterwards, although this likely combines the fundamental effect of espionage itself alongside any announcement effects. To narrow down the effect of announcement, we examine a firm’s CAR in the days immediately surrounding the announcement in Figure 24, Panel A. Estimates are noisy, but point towards a roughly 4% decline in the week after announcement.
In Figure 13, Panel B, we plot cumulative abnormal returns for firms that are victims of an unsuccessful espionage incident. We find that estimates are very noisy but positive. If those conducting espionage have any inside knowledge (for instance, because they are employees of the victim firm), they are likely to target firms that are soon to outperform. This suggests that, if anything, the effects reported above may be underestimates. However, other interpretations are compatible with the rise in firm value, particularly after an unsuccessful espionage incident is announced: the market may take this as a signal that the firm has valuable technology (worthy of being stolen) or update on a firm’s security capabilities.
8.1.0.5 Mean Reversion and Industry Dynamics
Figure 3 shows that firms that are targeted for espionage overwhelmingly tend to be leaders in their field—more than half of targeted firms are in the top 3 firms in their industry when they are targeted, often in very large industries. This fact raises concerns that our main specification could be confounded by industry dynamics; if espionage has no effect, but leader firms naturally decline compared to other firms in the same sector, then we might estimate that espionage has negative effects simply because of this mean reversion. To address this concern, in Figure 14, we show that industry leaders do not systematically mean-revert, especially when we focus on firms targeted by espionage. Importantly, this figure is centered on the quarter a firm first becomes an industry leader—often many years before any espionage incident—so it documents pre-espionage revenue stability among leaders rather than post-espionage performance.34
A related concern relates to whether industries targeted for espionage look systematically different from other similar industries, and thus may be selected, or simply have differences driven by idiosyncratic industry dynamics. If so, this could affect the interpretation of both industry level regressions (such as the analysis of trade flows), and the assignment of adjacent industries as never-treated firms. In Table 4, we test whether industries targeted by espionage exhibit similar dynamics to other industries sharing a SIC-3 code, and find that they are comparable, with no statistically significant differences in the persistence of industry leadership (columns 1-4), size difference between top firms (column 5), or HHI (column 6) between them.
8.2 Knowledge Diffusion Spillovers to Other Firms
Targeted firms are not the only firms that could endogenously respond to espionage. For example, Boeing might reduce its willingness to patent with Chinese inventors in response to espionage against Airbus. This is not only an independently important margin of response, but also an identification threat to the previous sections—by taking non-targeted firms as never-treated, we risk underestimating the endogenous response to espionage that could be common across firms.
One way to estimate this aggregate margin of response would be to aggregate all of our outcome measures to the industry level. However, a direct industry-level regression has too few targeted industries (roughly 50 unique SIC-4 codes) to yield informative estimates. We therefore implement the aggregate test at the firm-year level using a triple-difference between targeted and nearby SIC-4 codes. Thus, in this analysis, our never-treated group is firms in nearby SIC 4-digit codes—i.e. firms in the same SIC 3-digit code \(k(i)\) but not in the same SIC 4-digit code \(j(i)\). Let \(D_{j(i),t+k} = 1\) if firm \(i\) is in an SIC \(j(i)\) that has been targeted for espionage, and let \(l(i)\) denote the SIC-3 code of firm \(i\). Then the estimating equation is
\[\begin{equation} y_{i,t} = \sum_{k = -4}^{8} \gamma_k D_{i,t+k} + \sum_{k = -4}^{8} \delta_k D_{j(i),t+k} + \alpha_i + \alpha_{l(i),t} + \varepsilon_{i,t} \label{eq:spillover_ddd} \end{equation}\]
Here \(\gamma_k\) captures the direct effect of espionage on victim firms, while \(\delta_k\) captures the spillover response of competitor firms in the same targeted industry. Note that this specification includes SIC-3 by year fixed effects \(\alpha_{l(i),t}\), in contrast to the SIC-4 by year fixed effects used in Equation 1. This reflects the fact that our never-treated comparison group here consists of firms in nearby SIC-4 codes within the same SIC-3 industry. The competitor spillover effects we report in Figures 21 and 18 come from the \(\delta_k\) coefficients; victim firm effects are captured by the separate \(\gamma_k\) term.
For the employment outcomes, since Revelio Labs only provides NAICS codes and not SIC codes for firms in the LinkedIn data, we assign treatment at the NAICS 6-digit level, and we use firms in “nearby” NAICS 4-digit codes as the never-treated group. We only keep the first incident targeting an industry in estimation.
In Figure 18, we estimate the spillover impacts of espionage to patenting by other firms in the industry. Panel A shows that firms in industries targeted by espionage are about 5% more likely to file a patent, consistent with the small increases in the hiring of scientists that we observe. However, we find no effects on the likelihood of patents Taken together with the results on employment, these results suggest that firms in industries targeted by espionage may try to increase their innovation activities—potentially to develop a lead over the stolen technology, or to outcompete the victim firm—but that they do not necessarily become less open to foreign collaboration and innovation.
In Figure 21, we estimate the spillover impacts of espionage to the employment of other firms in the targeted industry. Panels A and B reveal that firms in industries targeted by espionage also appear to hire slightly fewer employees, in the 5-10% range, among both Asians and non-Asians.35 On the other hand, Panels C and D reveal that the hiring of scientists does not change at untargeted firms, both among Asian and non-Asian scientists—suggesting that that untargeted firms do not necessarily update their hiring practices from the occurrence of espionage in other firms in their industry.
One explanation for this non-response even at the industry level is that firms’ decisions about optimal openness depend on their perception of espionage risk. As such, even if espionage makes them less open to knowledge flows, they might not respond to individual events of espionage. Indeed, given that many sectors are targeted repeatedly (Table 1) and thus presumably face a high background espionage risk, this is the natural interpretation to our null findings on the endogenous response of firms. However, our estimation only includes the first time an industry is targeted for espionage. Thus, as long as the first espionage incident in a sector updates firms’ beliefs about espionage risk, our strategy should capture the responses of firms to espionage. The fact that we find no effects on other firms even from the first espionage incident in a sector implies that this is not simply an artifact of firms having generally well-calibrated beliefs about espionage.36
9 Additional Tables and Figures
Panel A: Revenue
Panel A.1: Industry is SIC Panel A.2: Industry is
SIC3
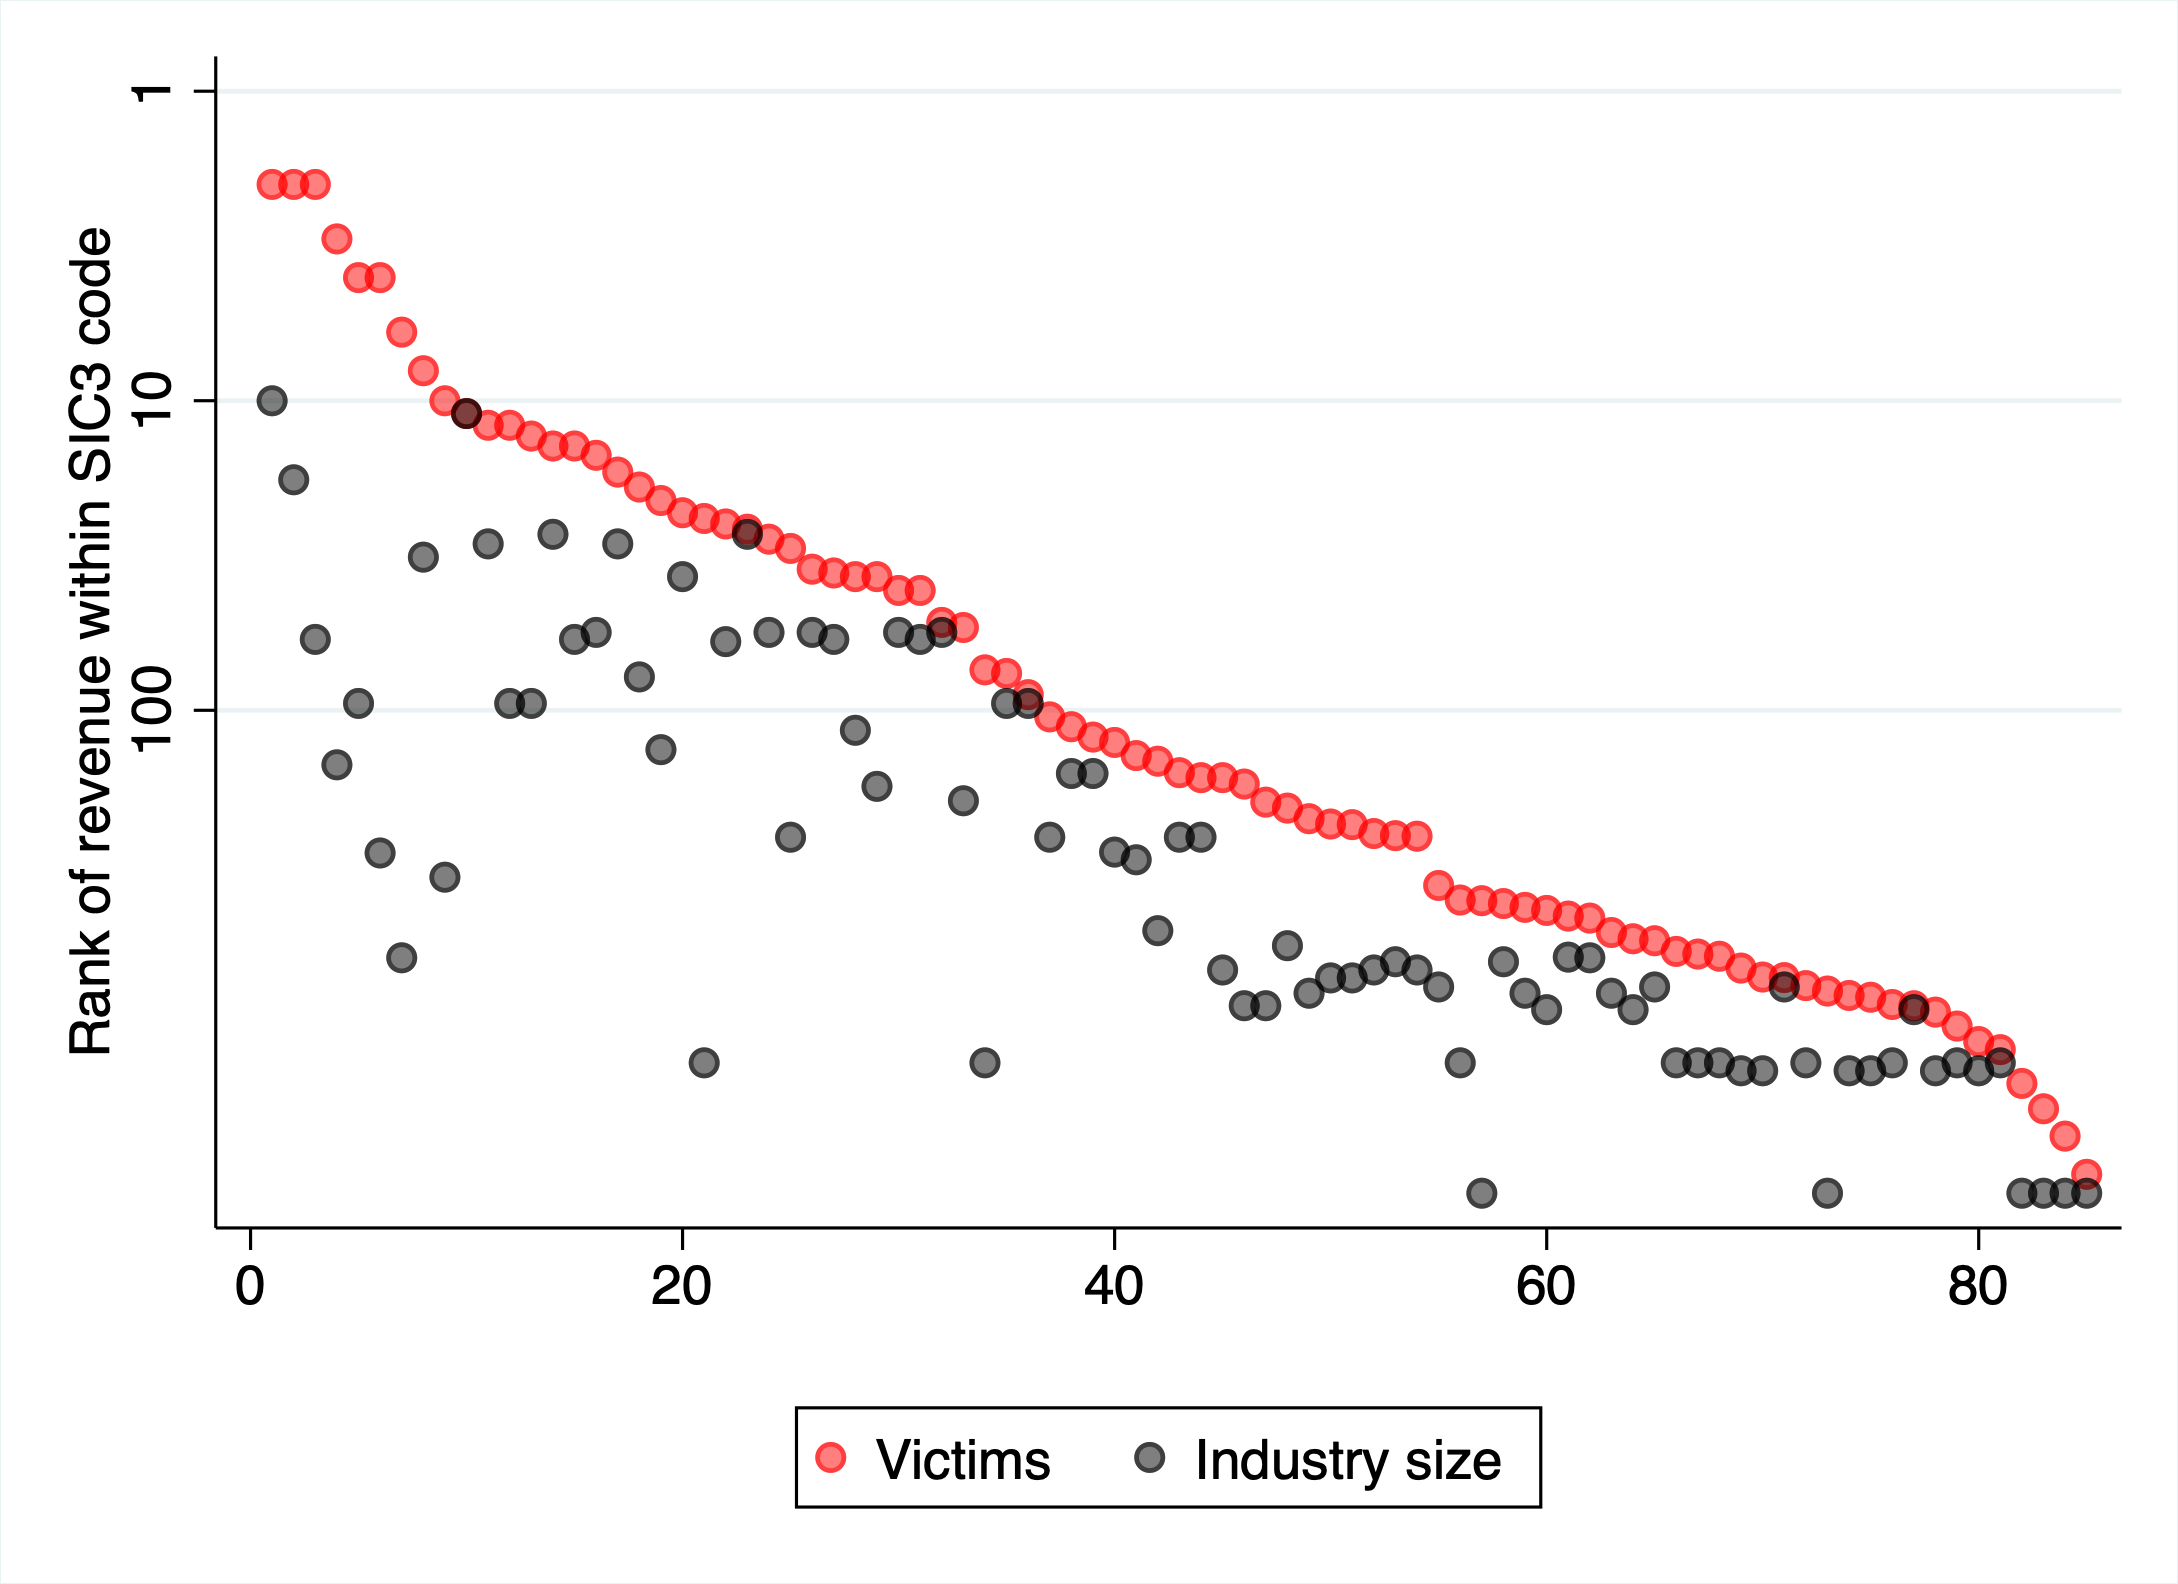
Panel B: R&D expenditures
Panel B.1: Industry is SIC Panel B.2: Industry is
SIC3
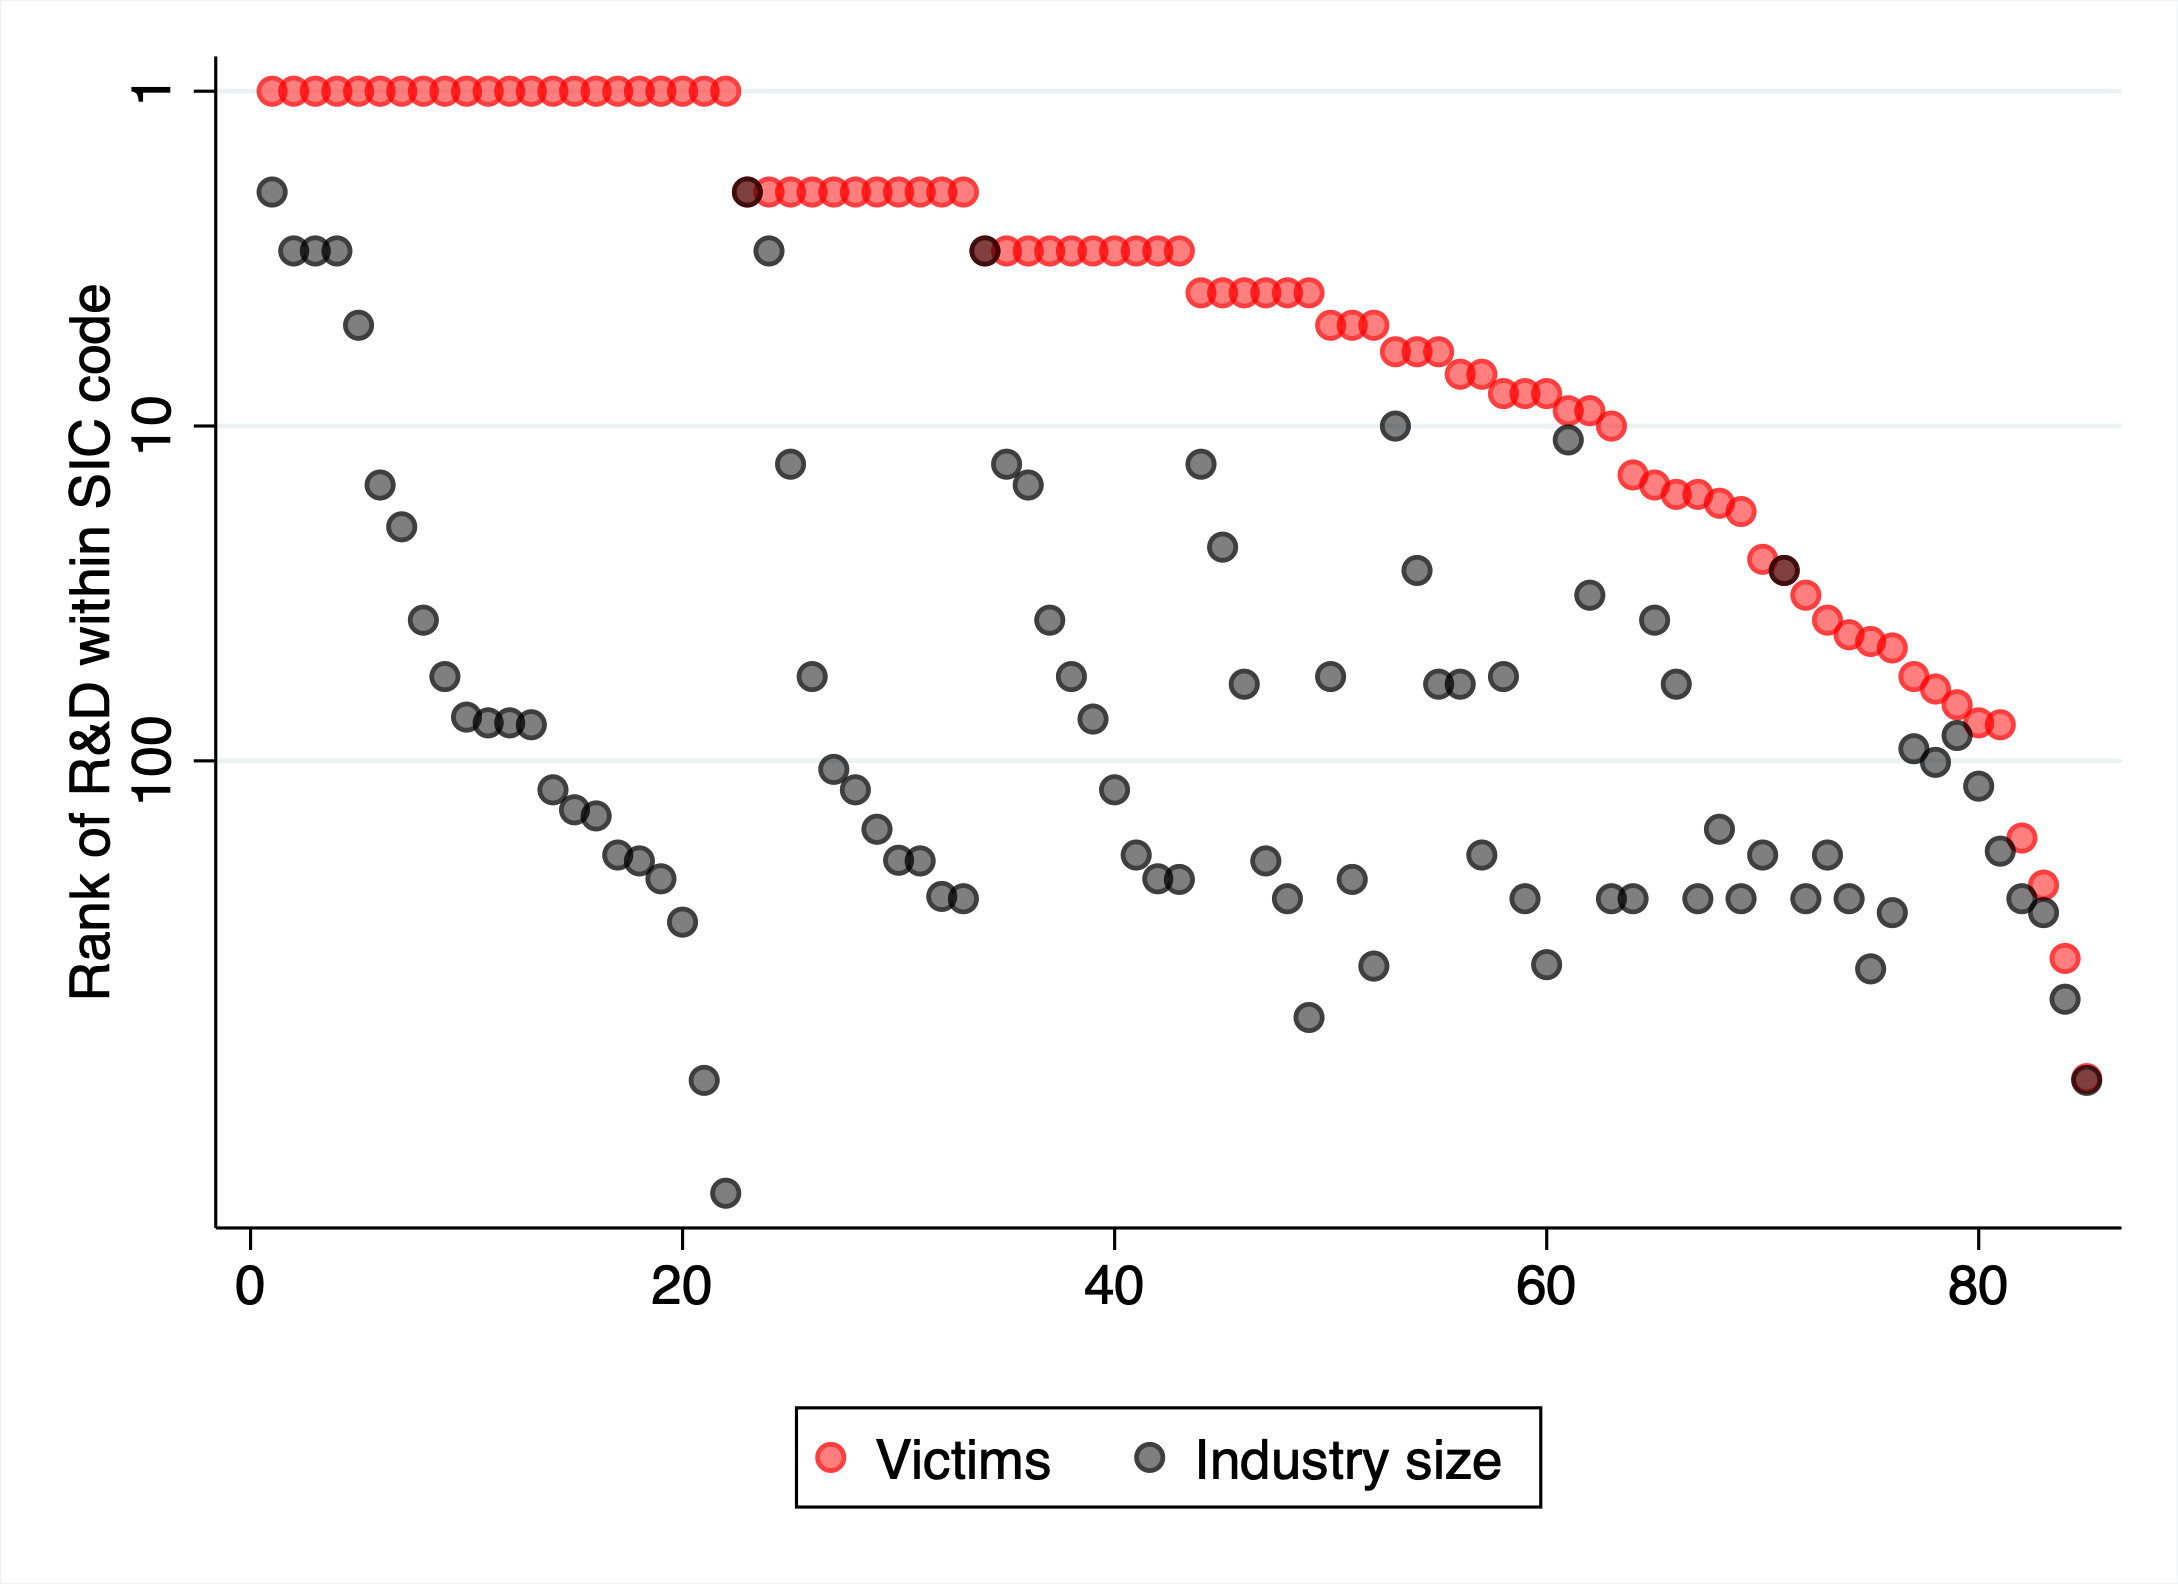
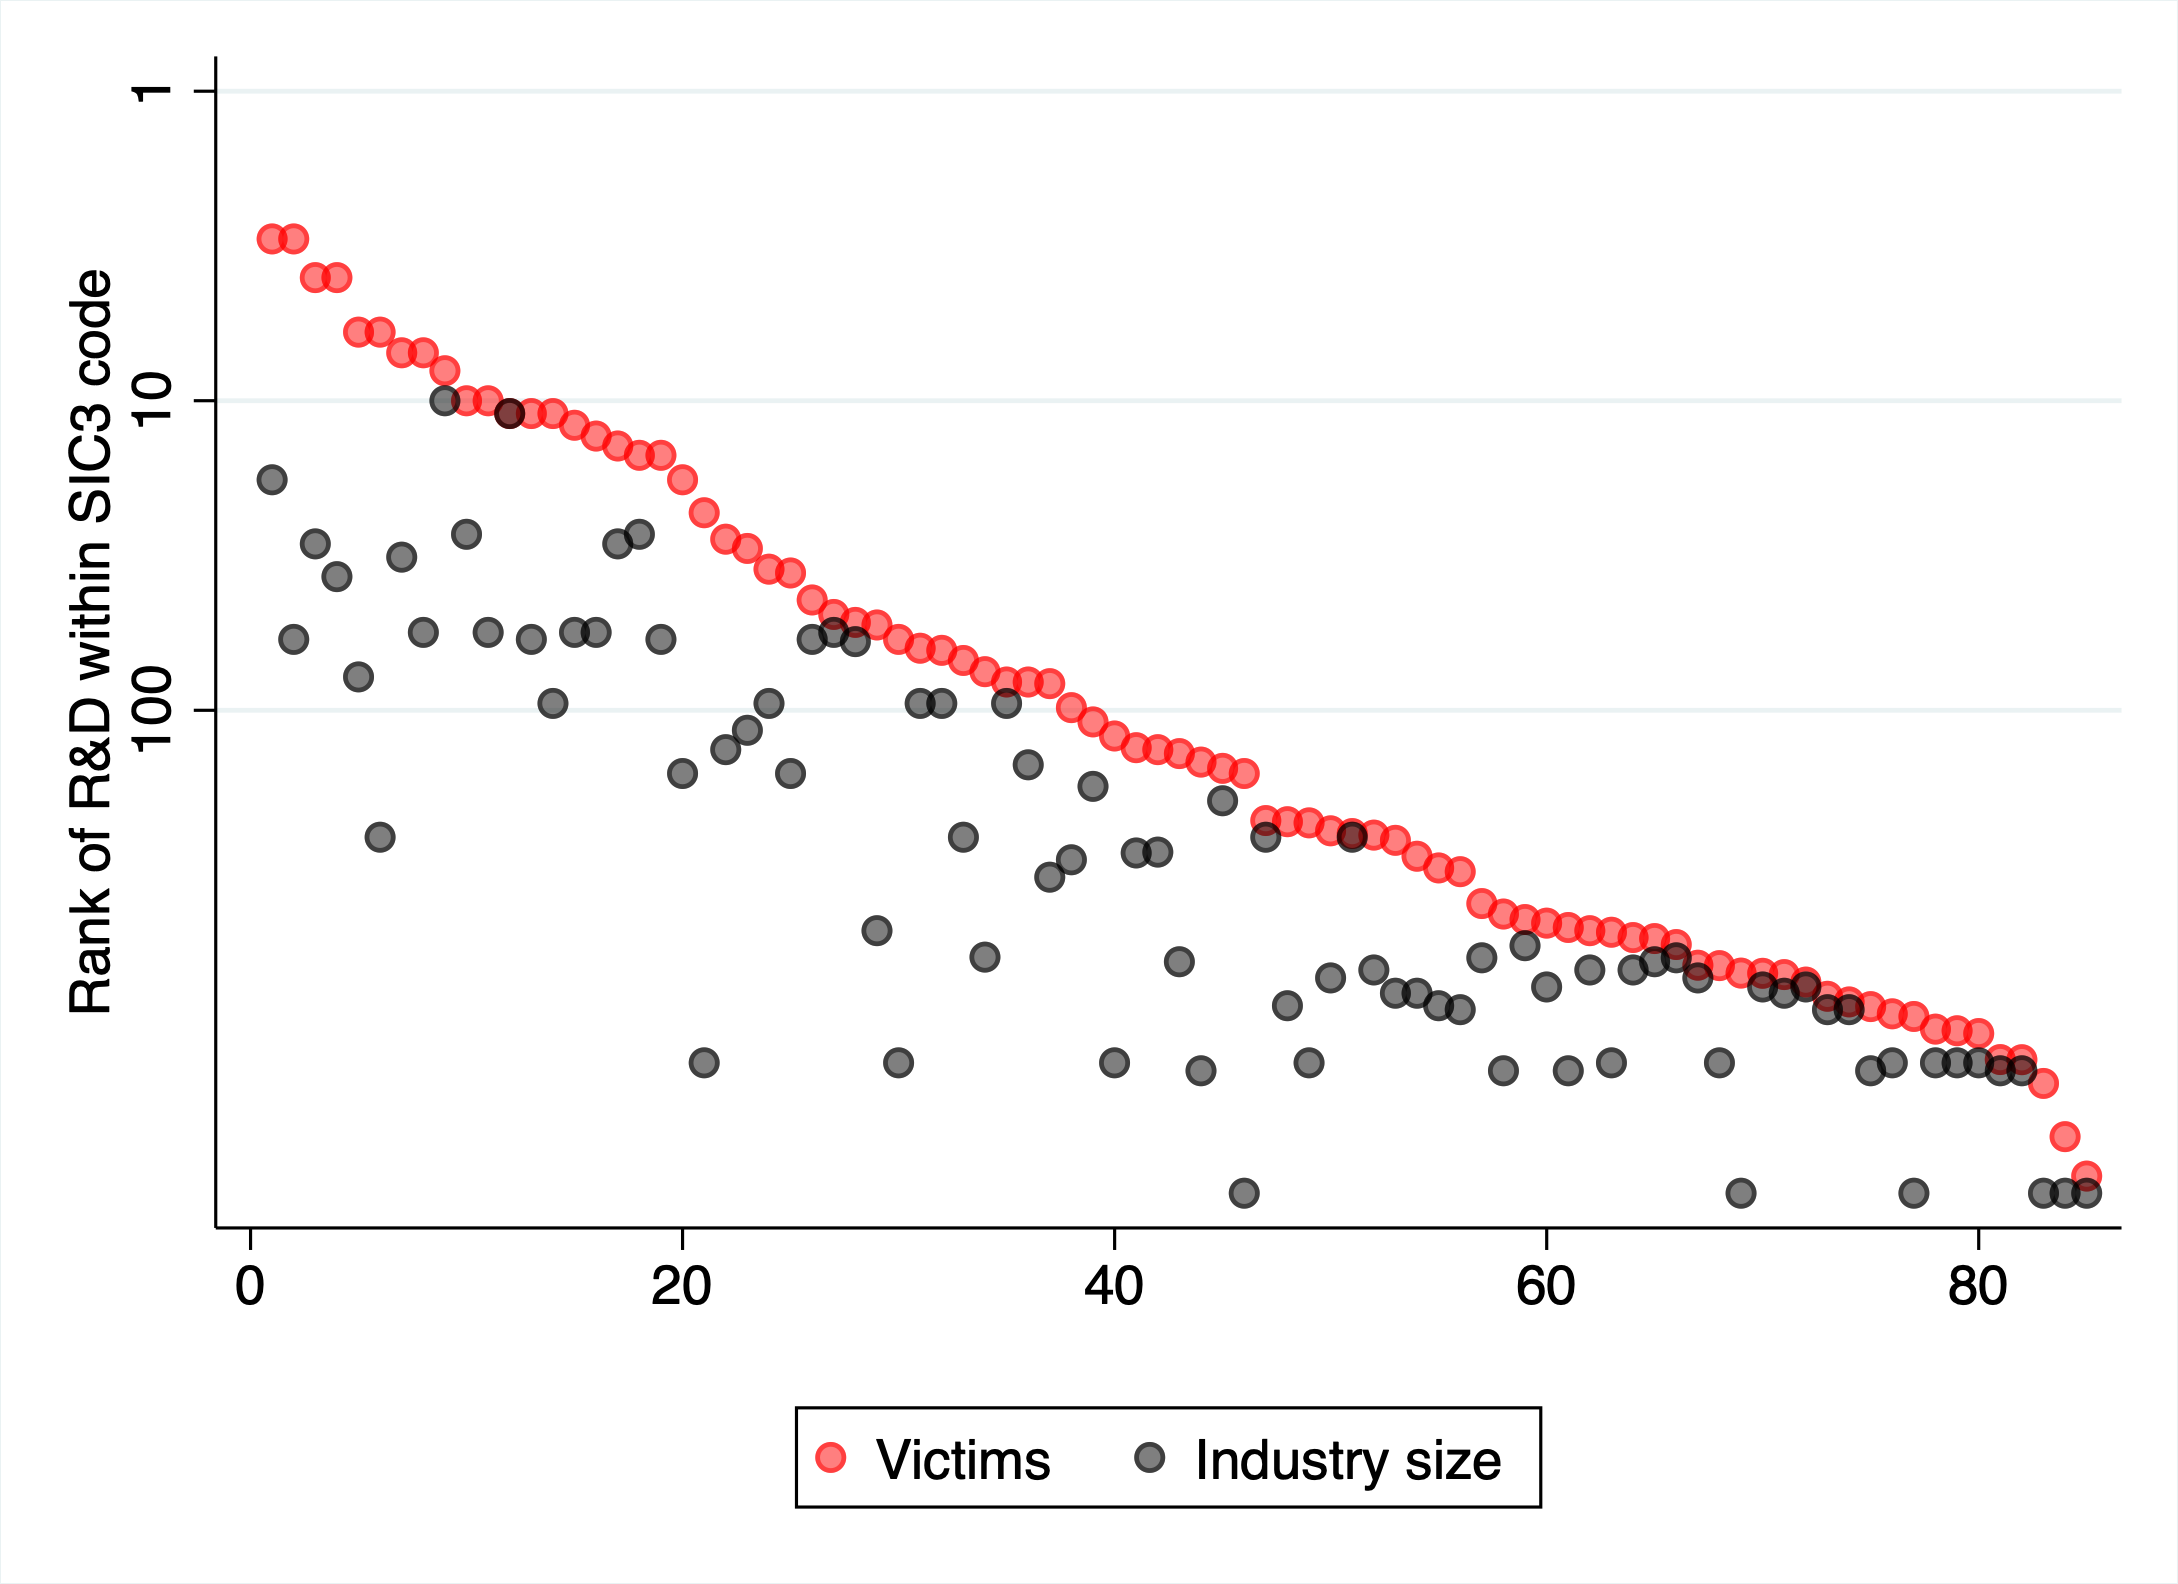
Note: This figure plots the rank of victim firms by size within their industry in red, and the size of their industry in gray. In Panels A and B, revenue is used as an indicator for firm size. In Panels C and D, R&D expenditures are used as an indicator for firm size. In Panels A and B, a firm’s industry is defined as their SIC (4 digit) code. In Panels C and D, a firm’s industry is defined at the SIC 3 digit code level. Firms are ordered by rank, and then industry size. The y-axis uses a log-scale. Revenue and R&D are both calculated as the average value prior to an espionage incident taking place.
Panel A: Successful cases
Panel A.1: log(Revenue) Panel A.2: log(R&D)
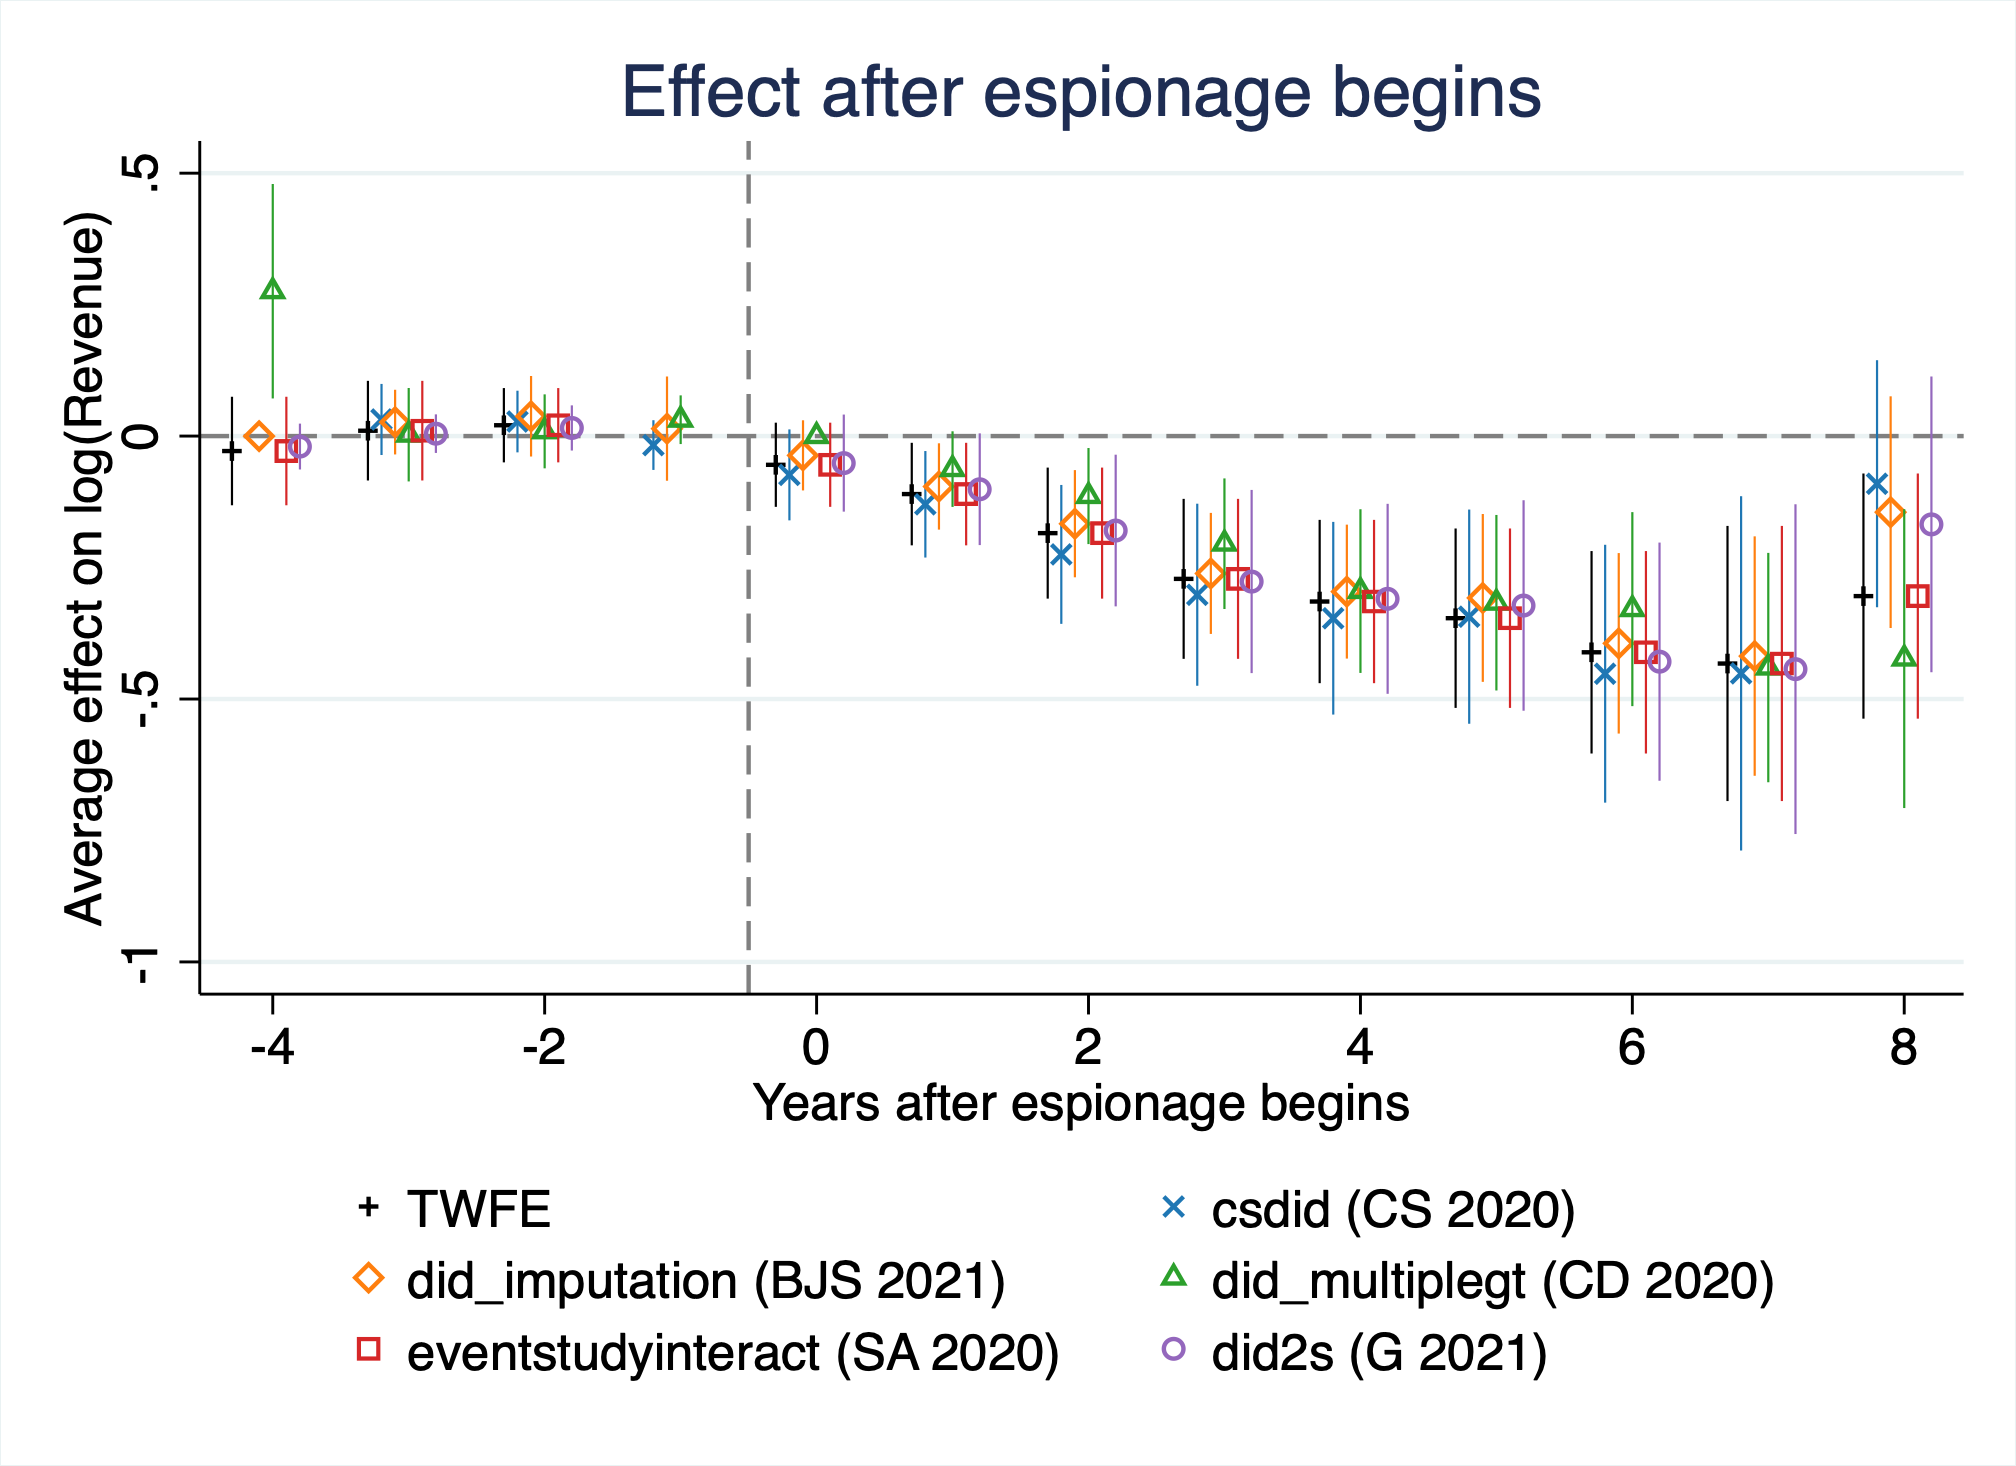
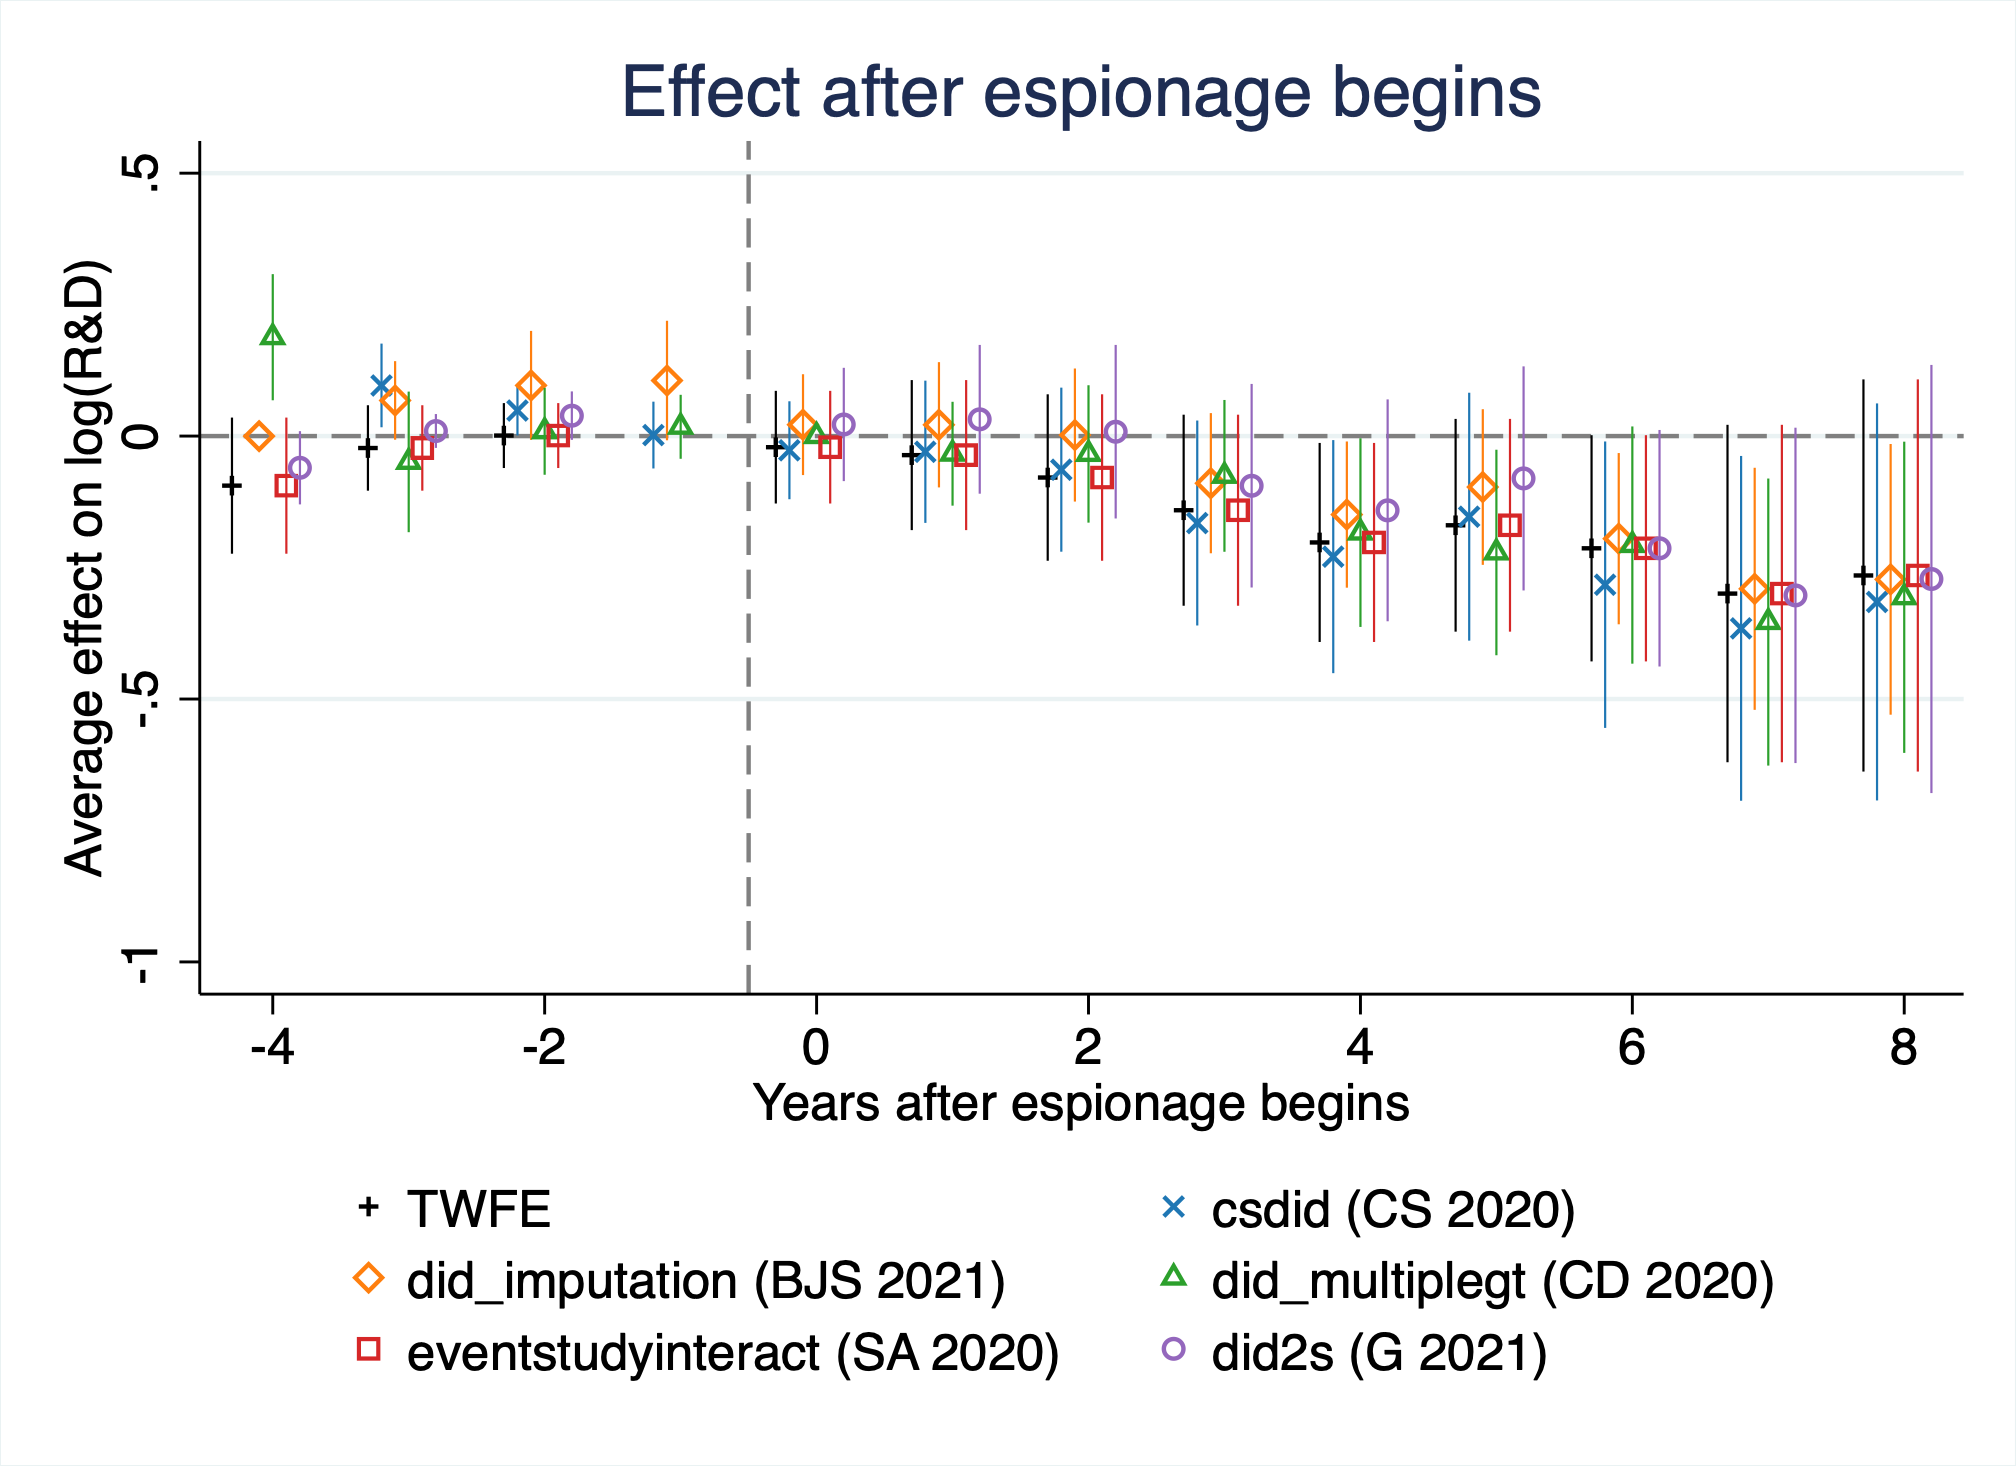
Panel B: Unsuccessful cases
Panel B.1: log(Revenue) Panel B.2: log(R&D)
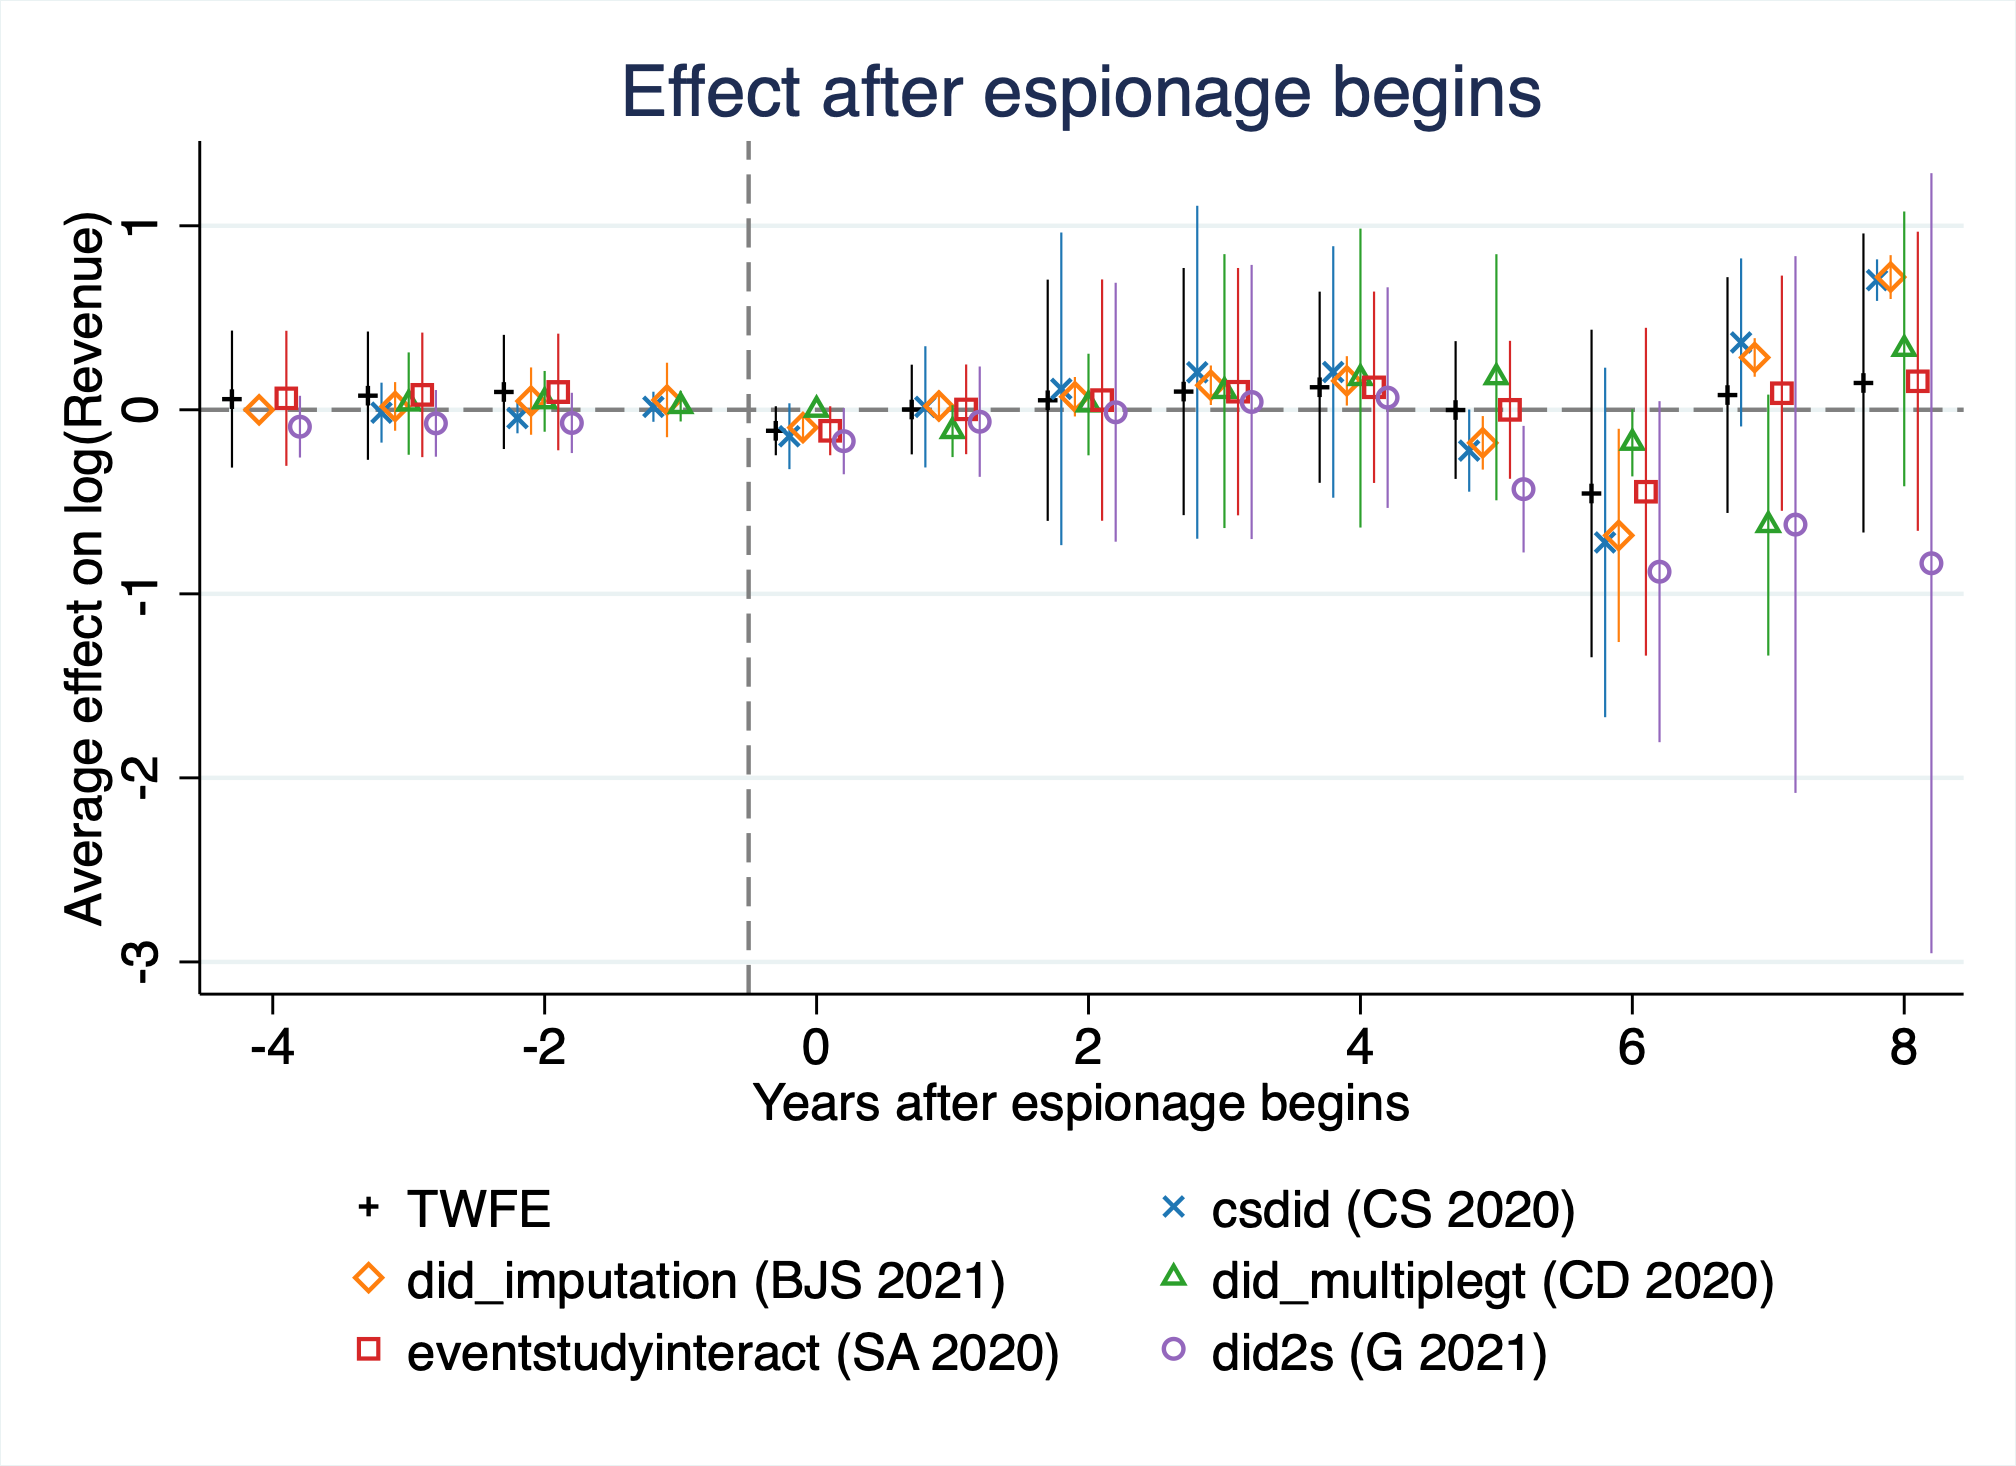
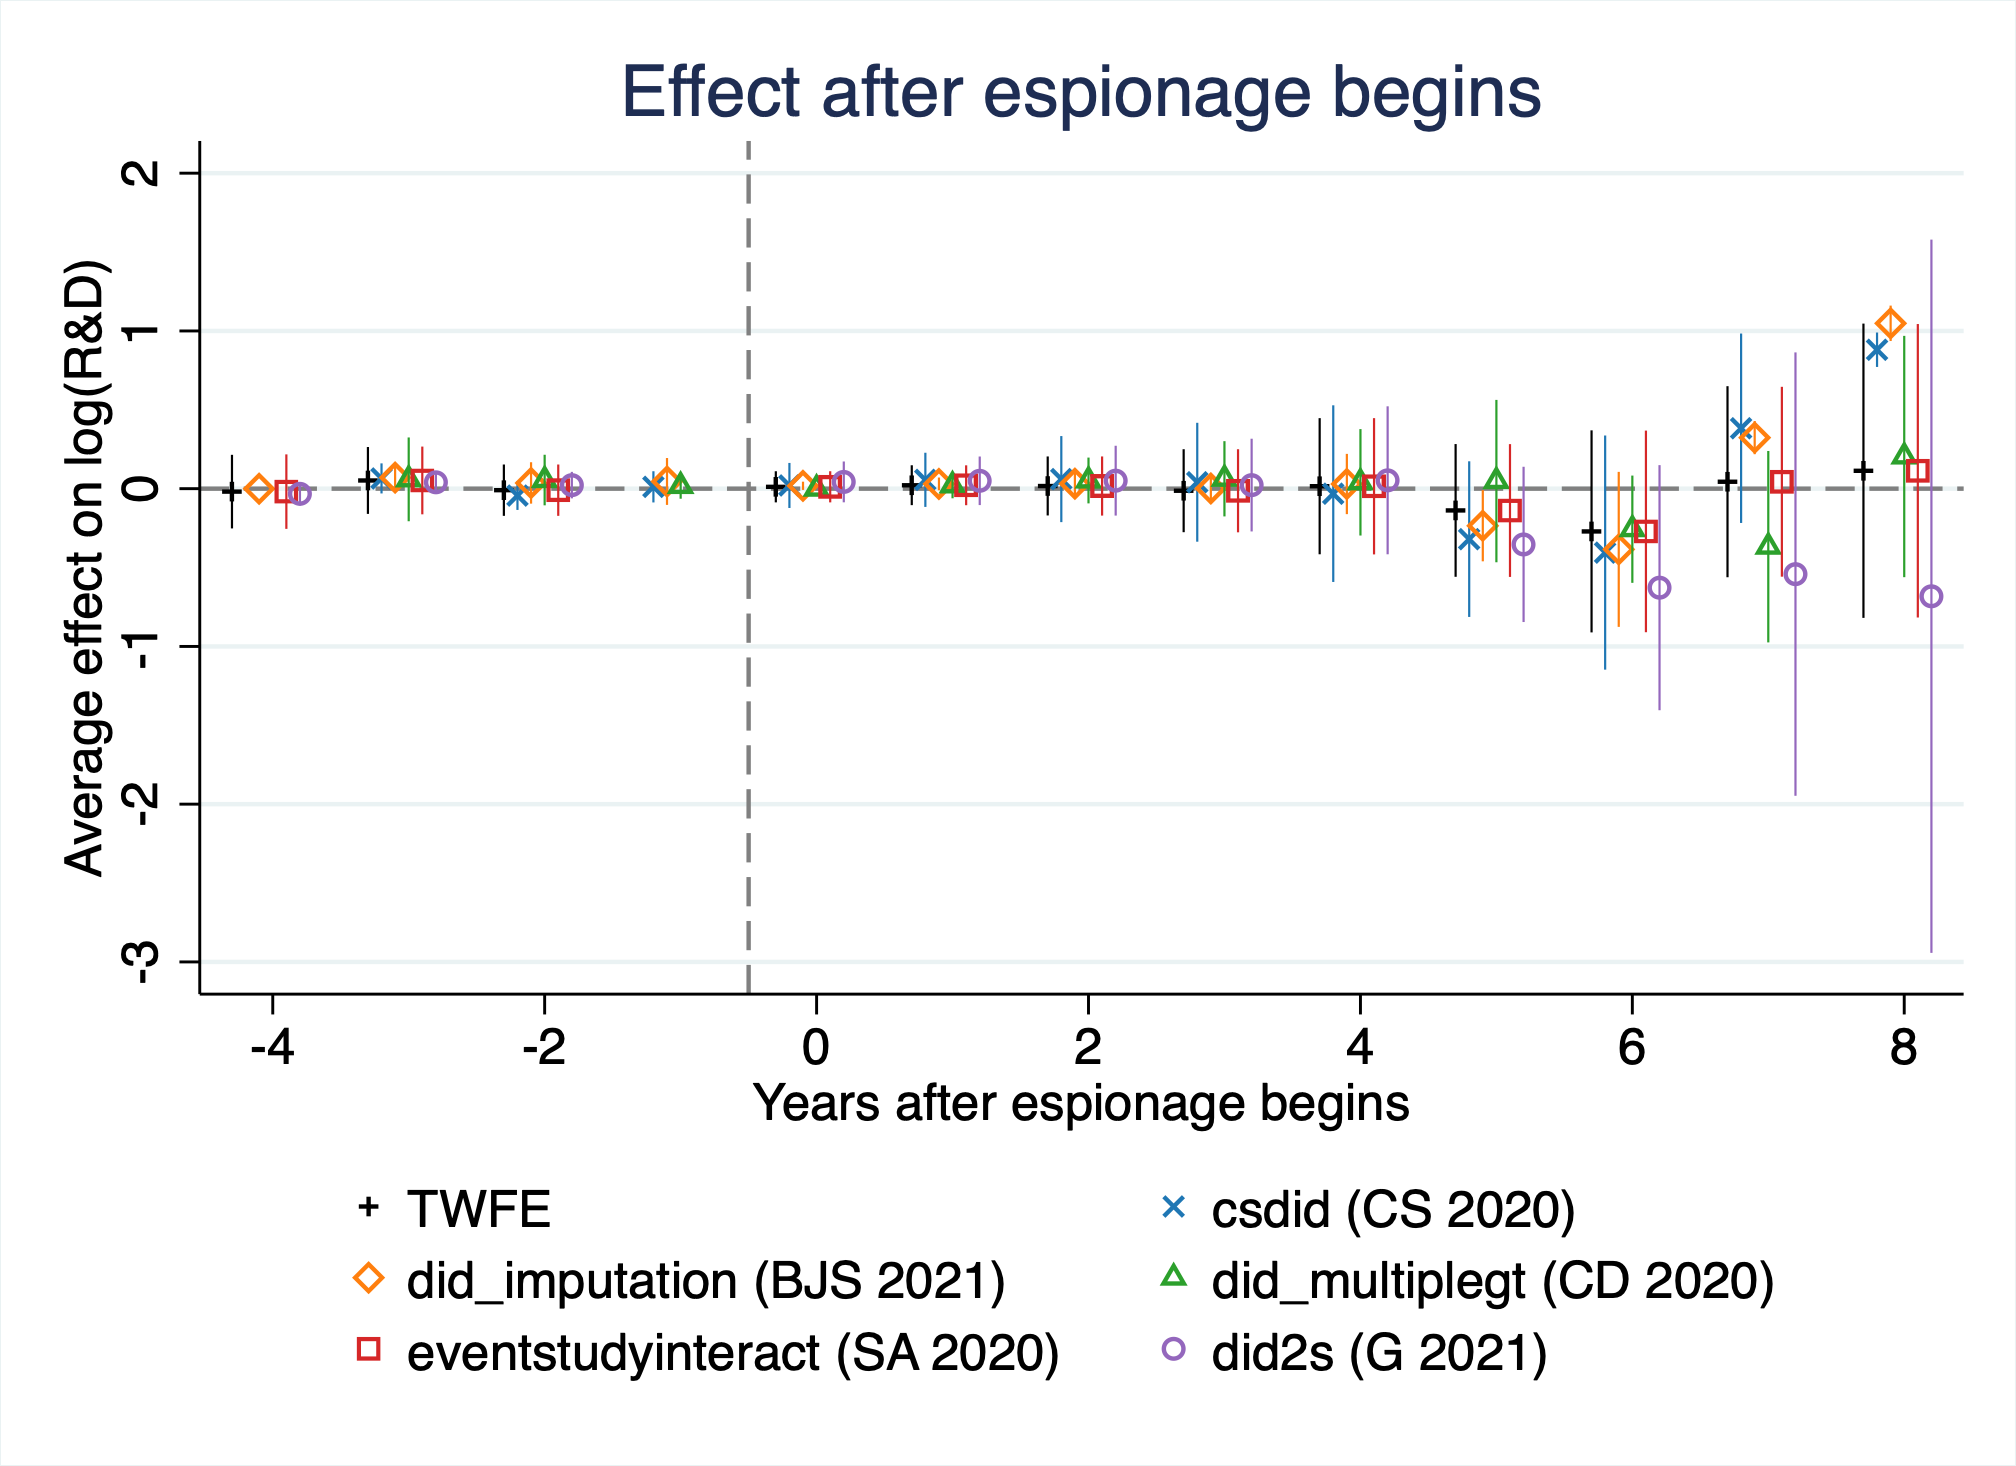
Note: This figure plots coefficients and 95% confidence intervals from various heterogeneous dynamic difference-in-difference specifications. In Panel A, an event is a firm being successfully targeted for economic espionage. In Panel B, events are unsuccessful cases of economic espionage, where the desired information was not successfully given to its intended recipient. The outcome in Panels A.1 and B.1 is a firm’s log(Revenue) and in Panels A.2 and B.2, a firm’s log(R&D expenditures). Black crosses present estimates from a standard two-way fixed effect design, blue crosses present estimates using Callaway and Sant’Anna (2021), orange diamonds present estimates using Borusyak, Jaravel, and Spiess (2023), green triangles present estimates using de Chaisemartin and D’Haultfoeuille (2024), red squares present estimates using Sun and Abraham (2020), and purple circles present estimates using Gardner (2021). Standard errors are clustered at the firm level.
Panel A: log(Assets) Panel B: log(Intangible
assets)
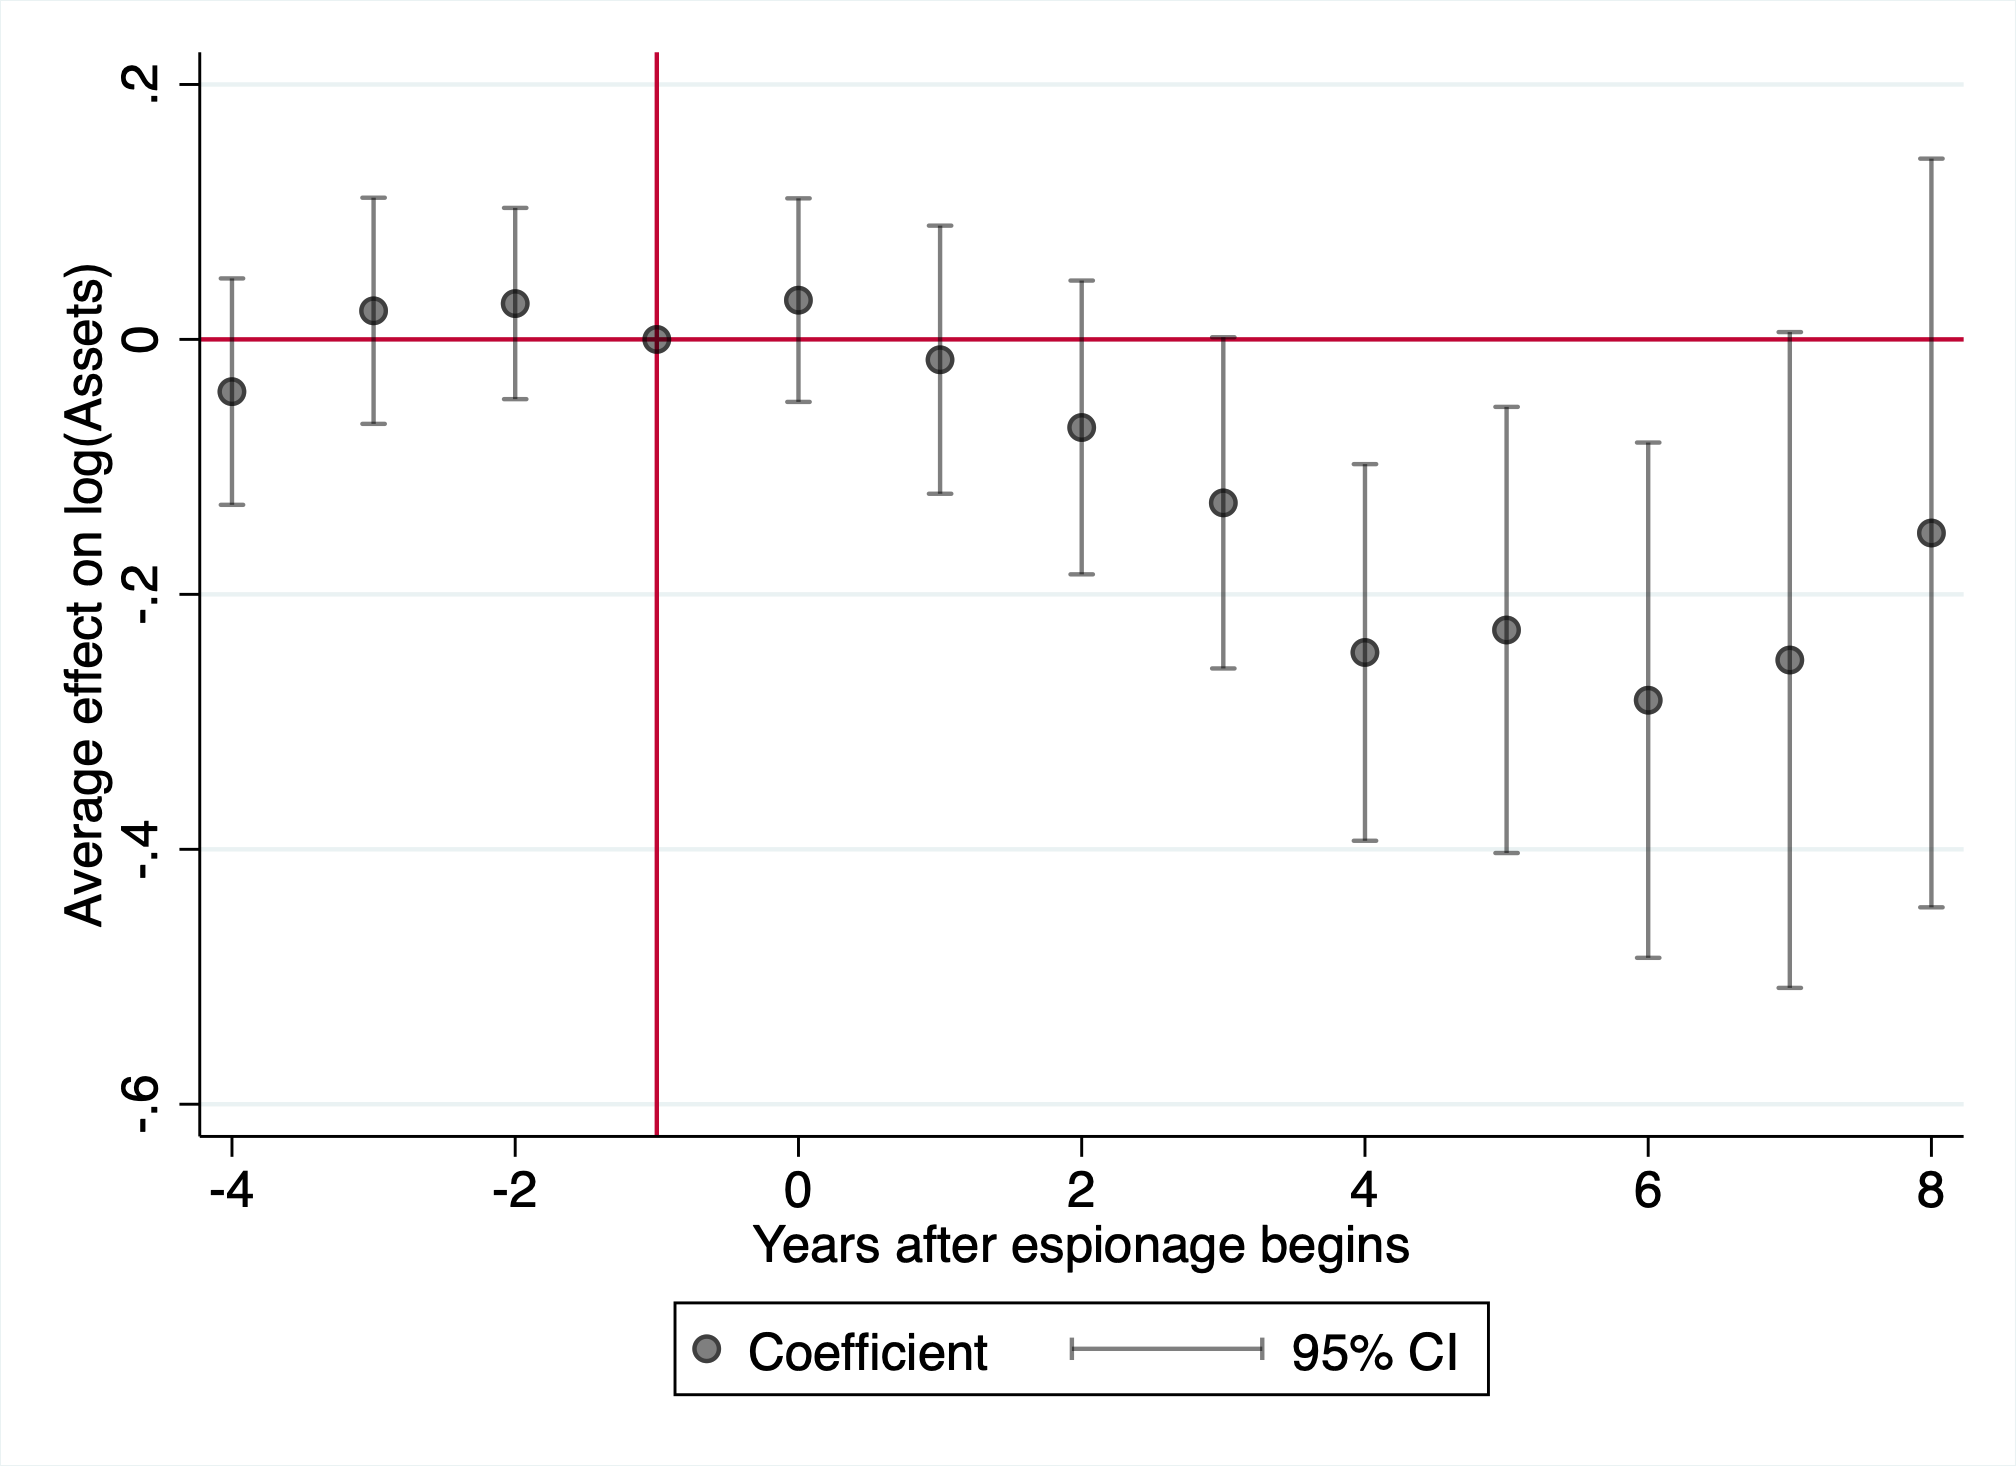
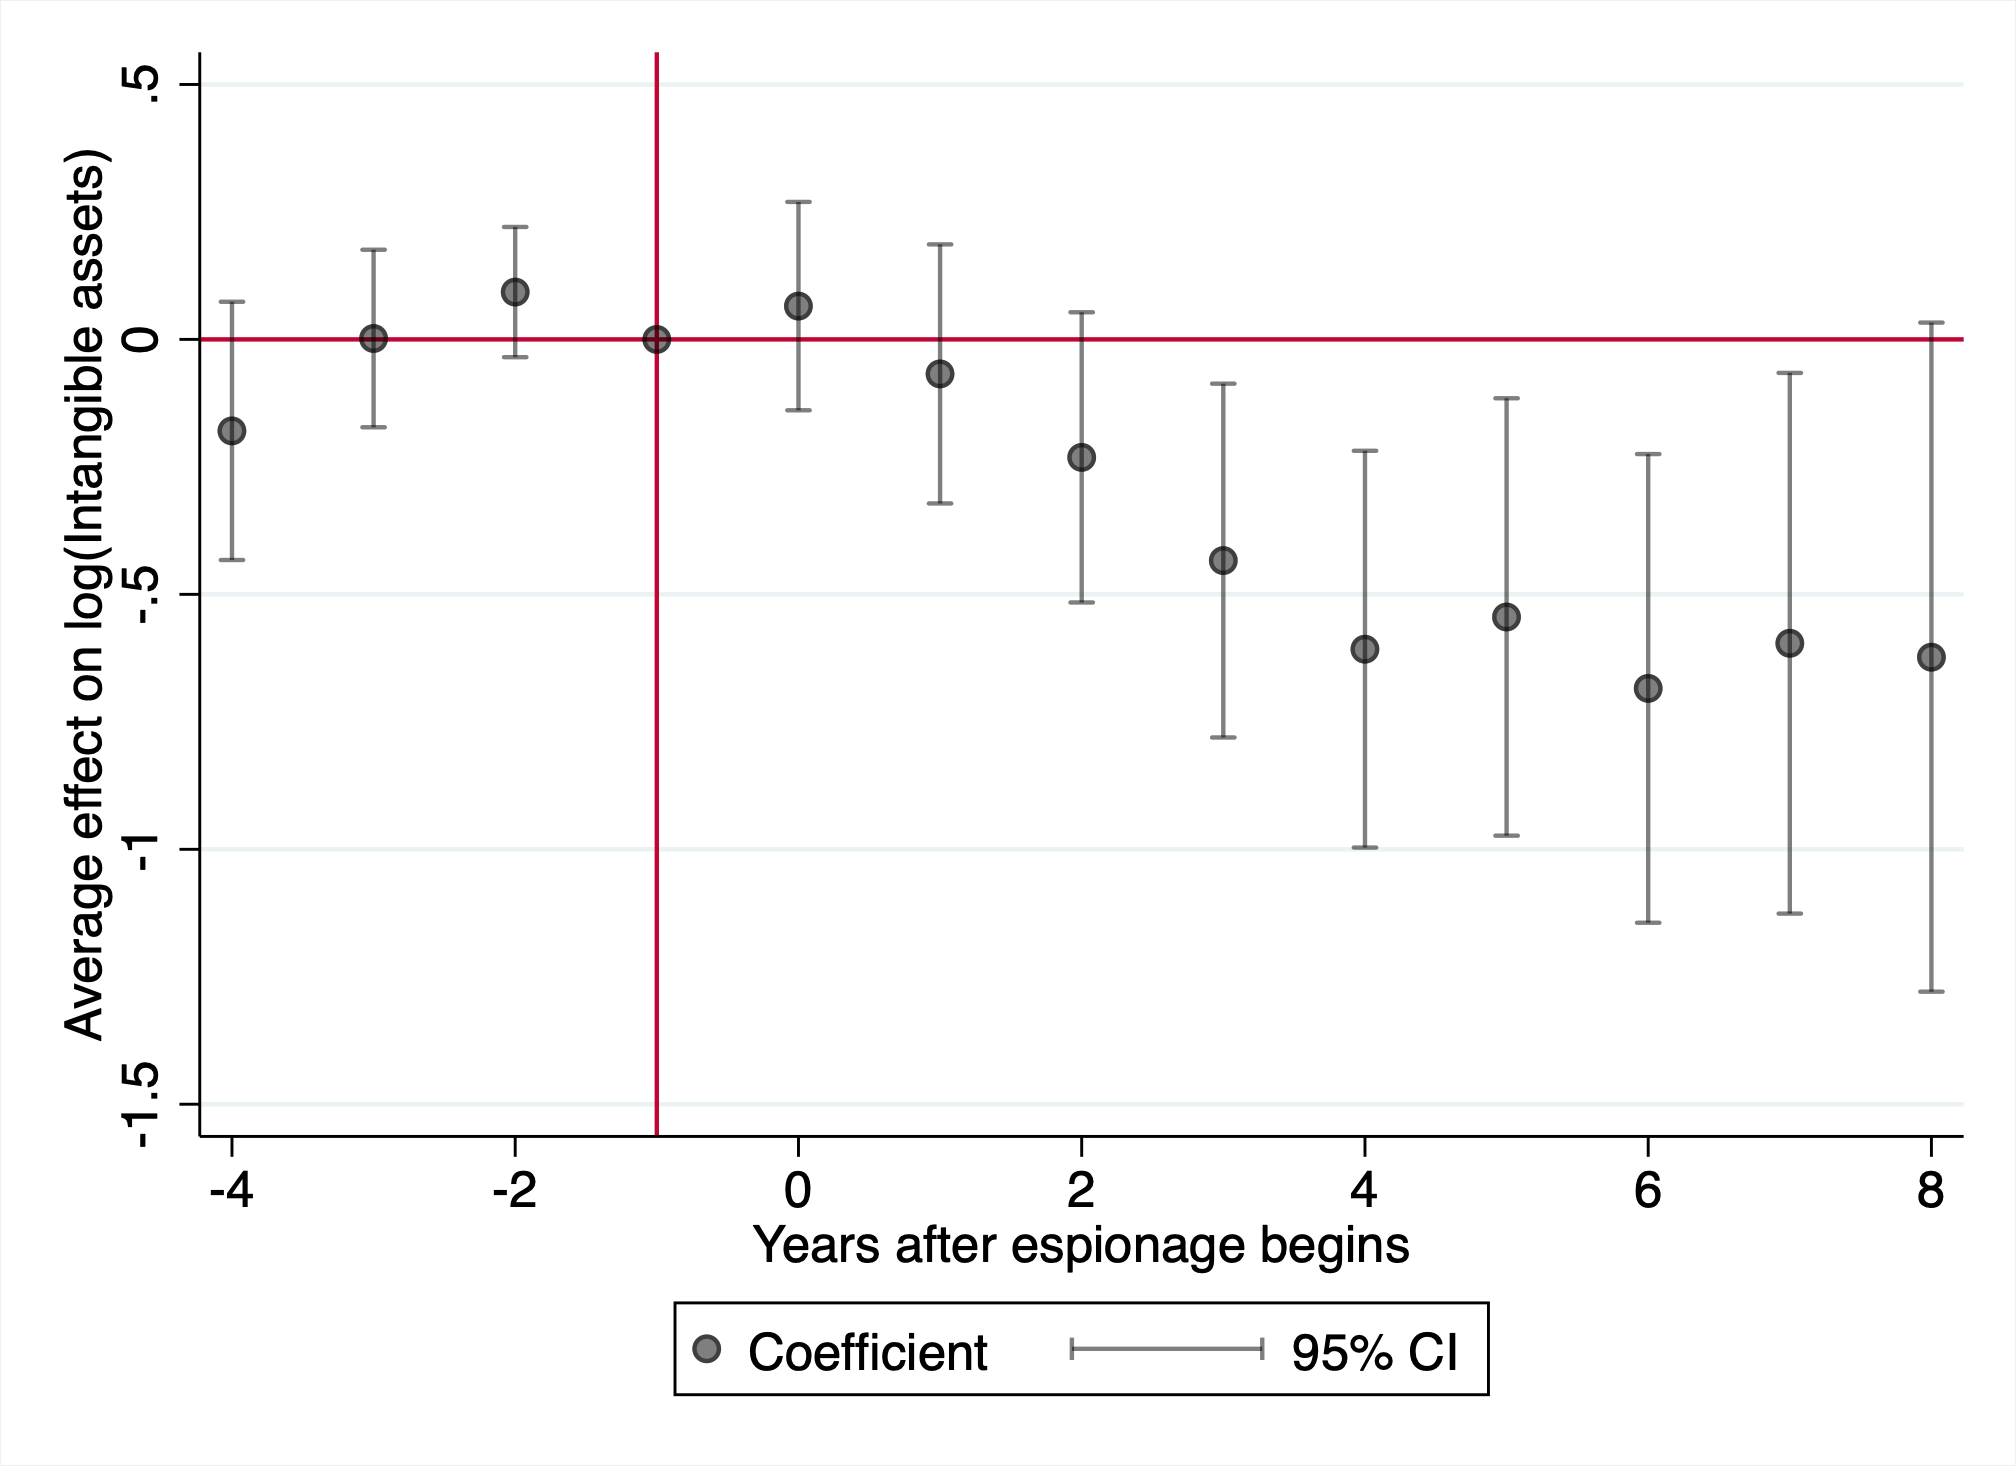
Panel C: Gross margin Panel D: Net profit
margin
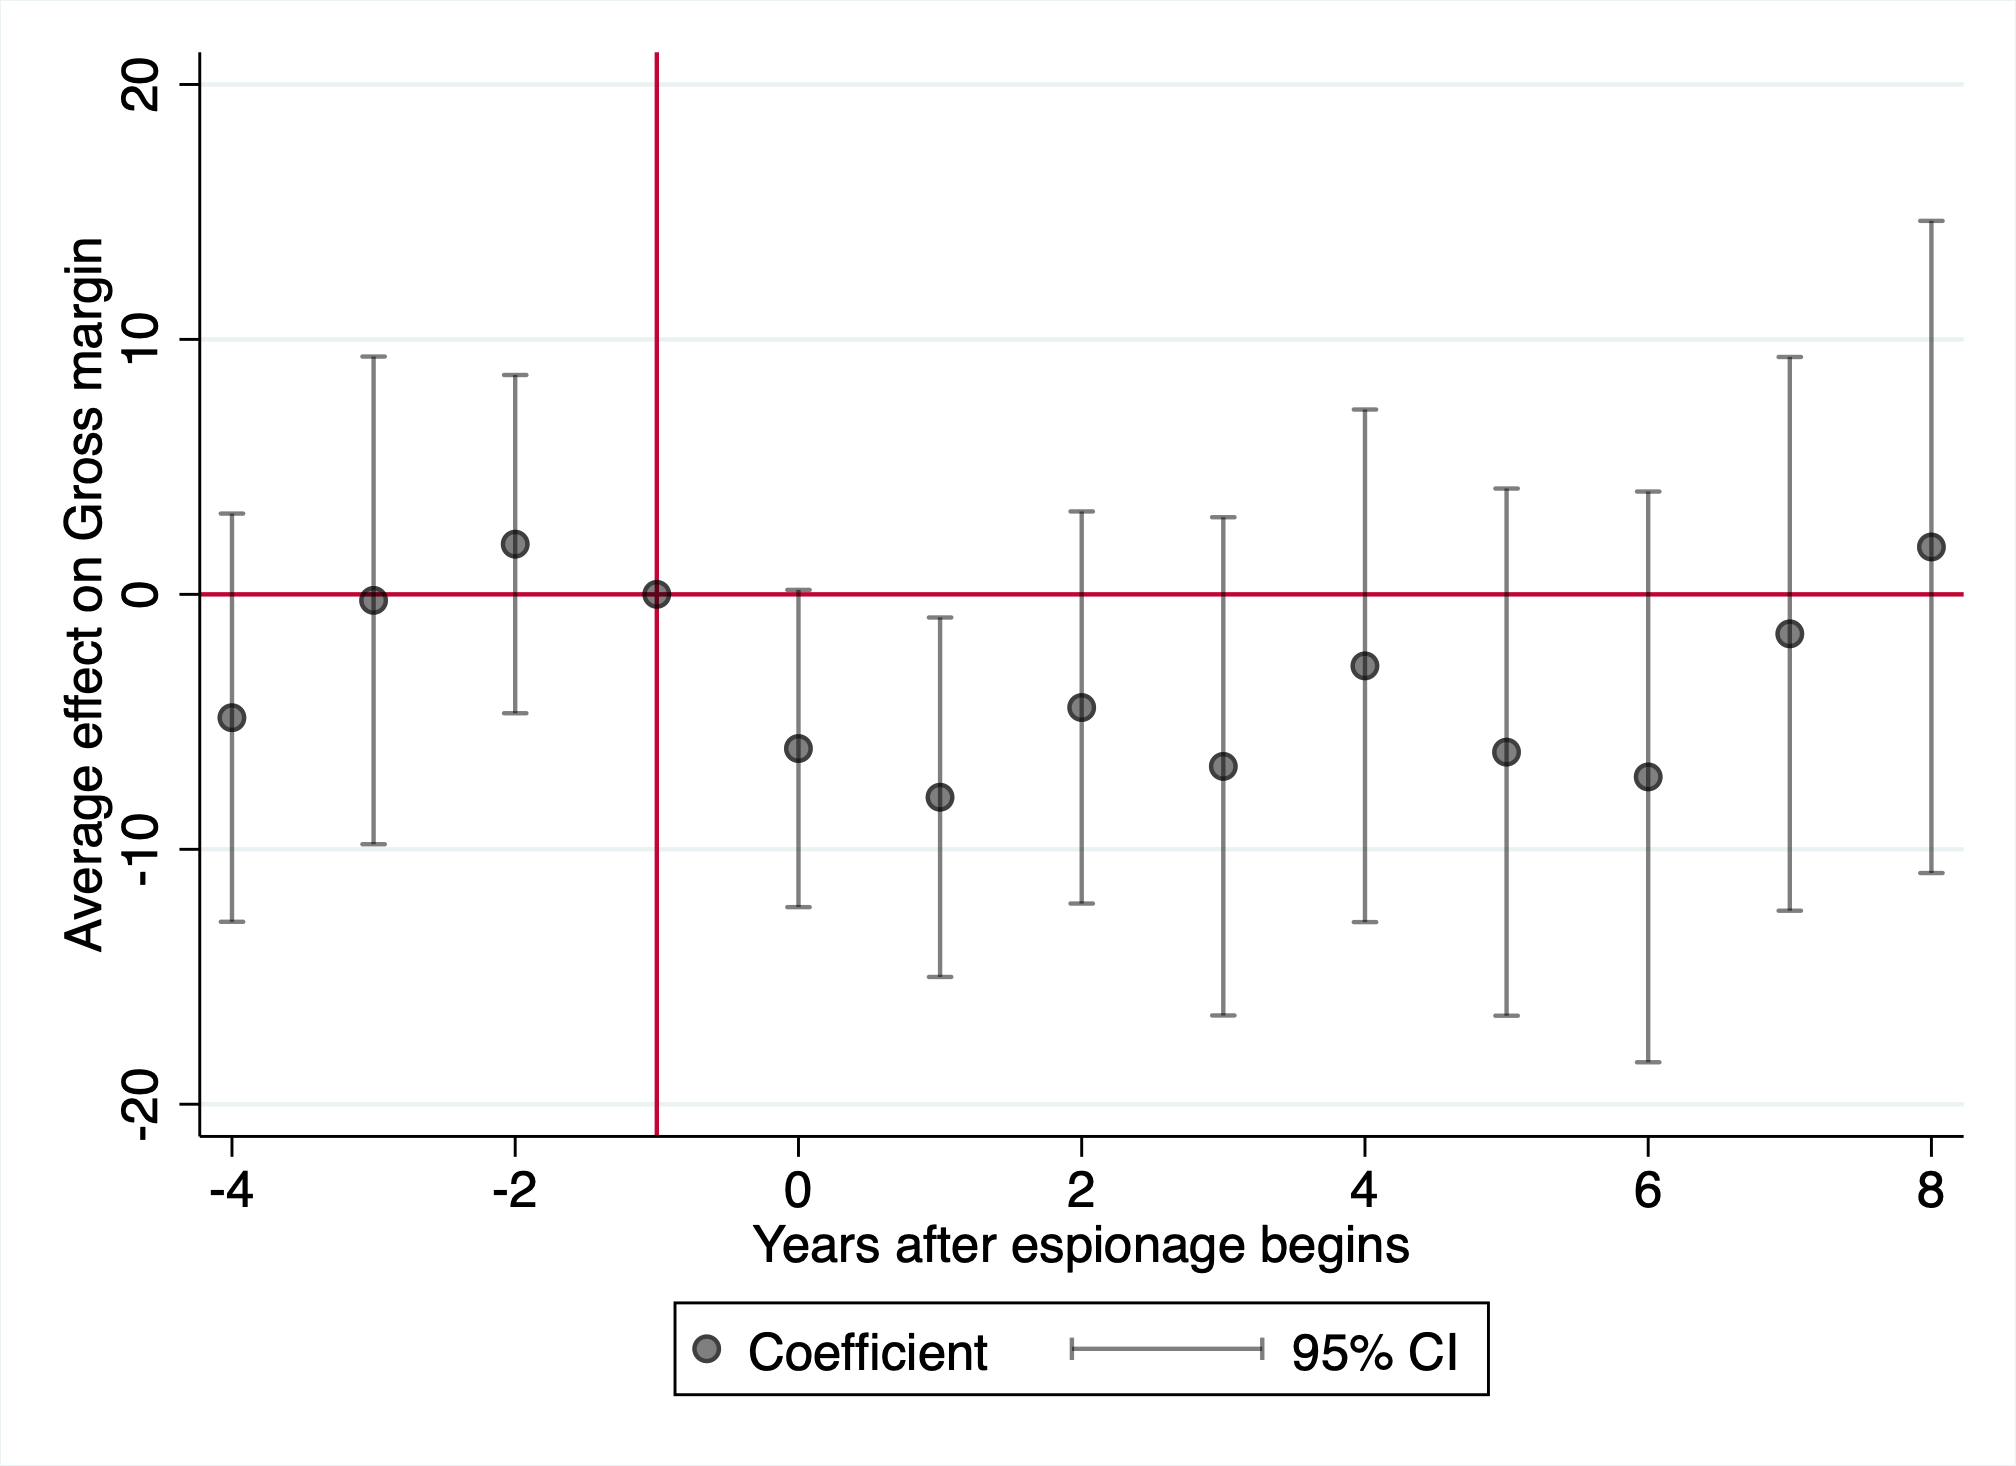
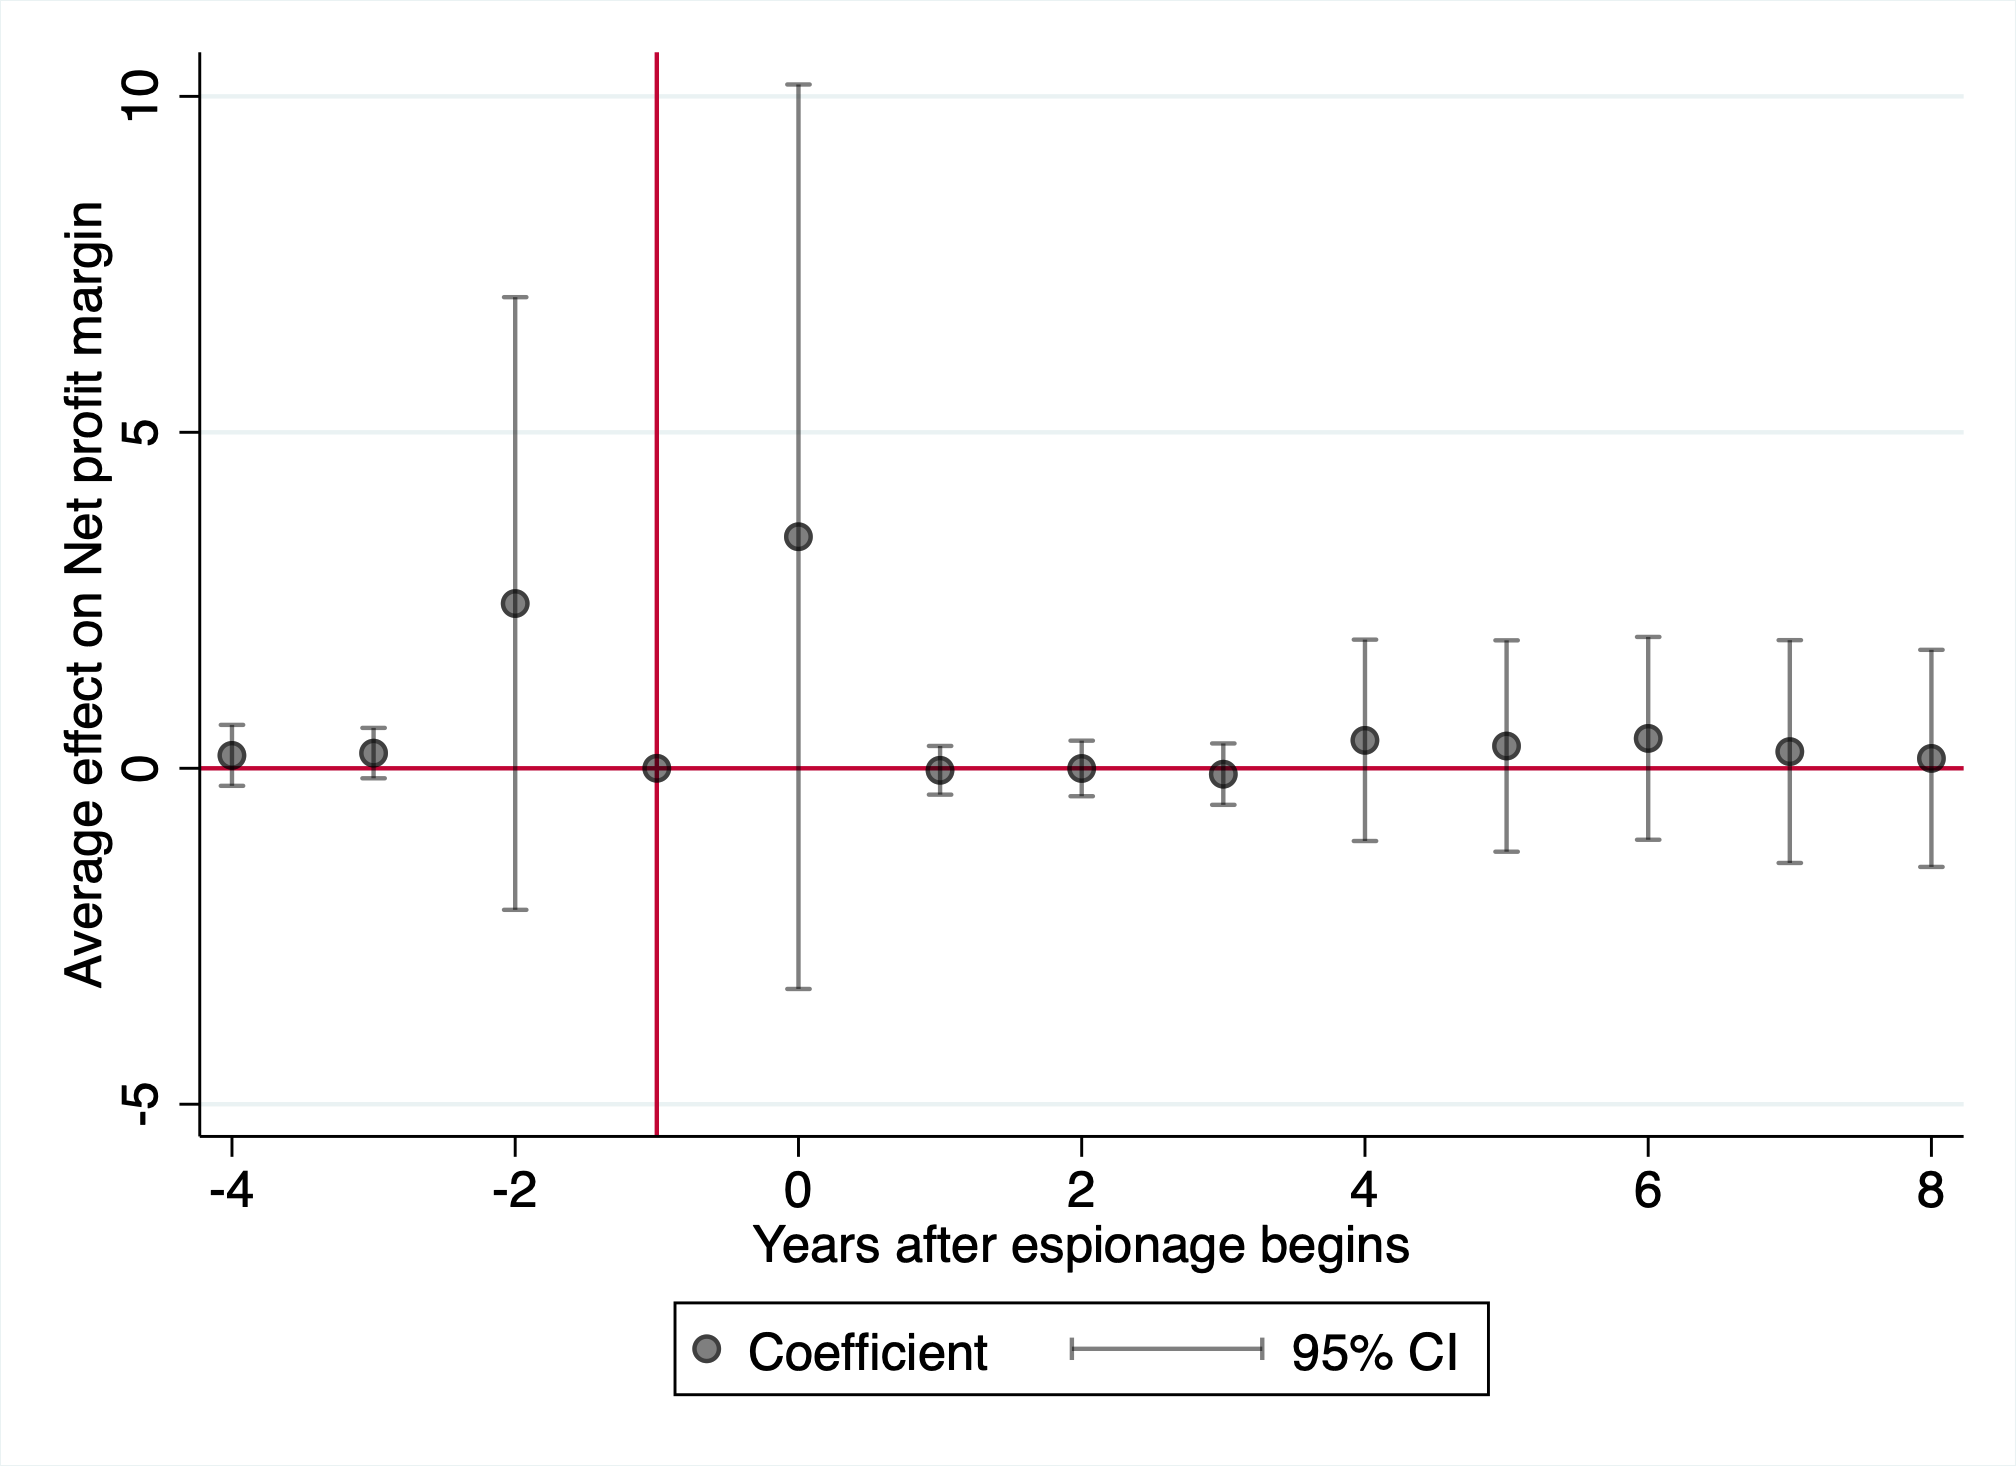
Note: This figure plots coefficients and 95% confidence intervals from various heterogeneous dynamic difference-in-difference specifications. An event is a firm being successfully targeted for economic espionage. The outcome in Panels A is a firm’s log(Assets), in Panel B a firm’s log(Intangible assets), in Panel C a firm’s gross margin, and in Panel D a firm’s net profit margin.
Panel A: Successful cases
Panel A.1: log(Revenue) Panel A.2: log(R&D)
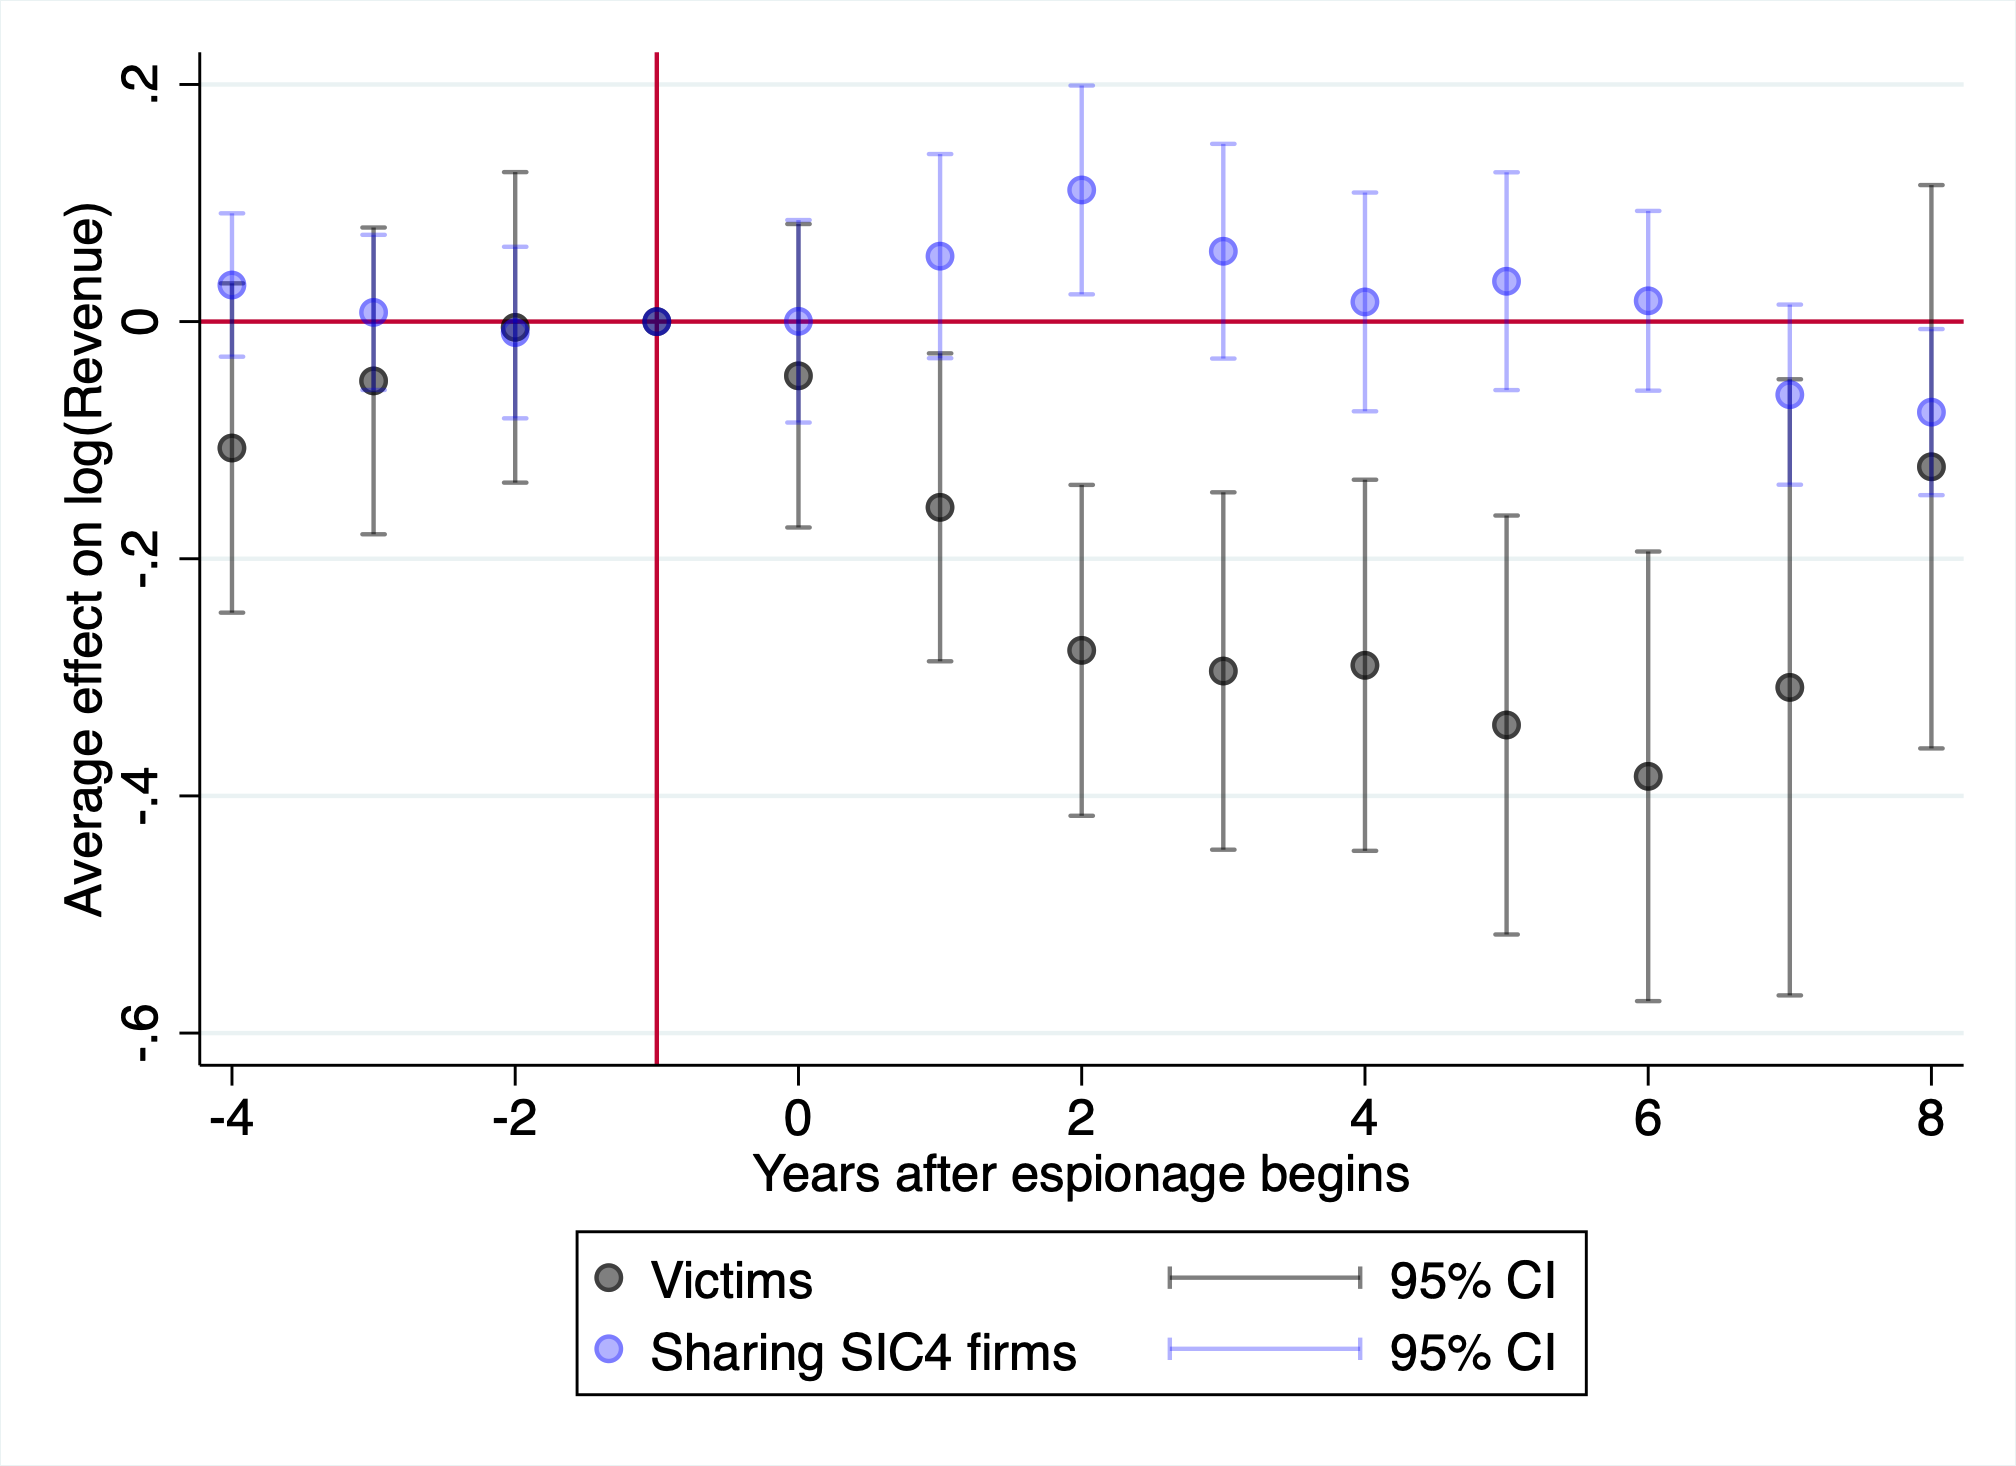
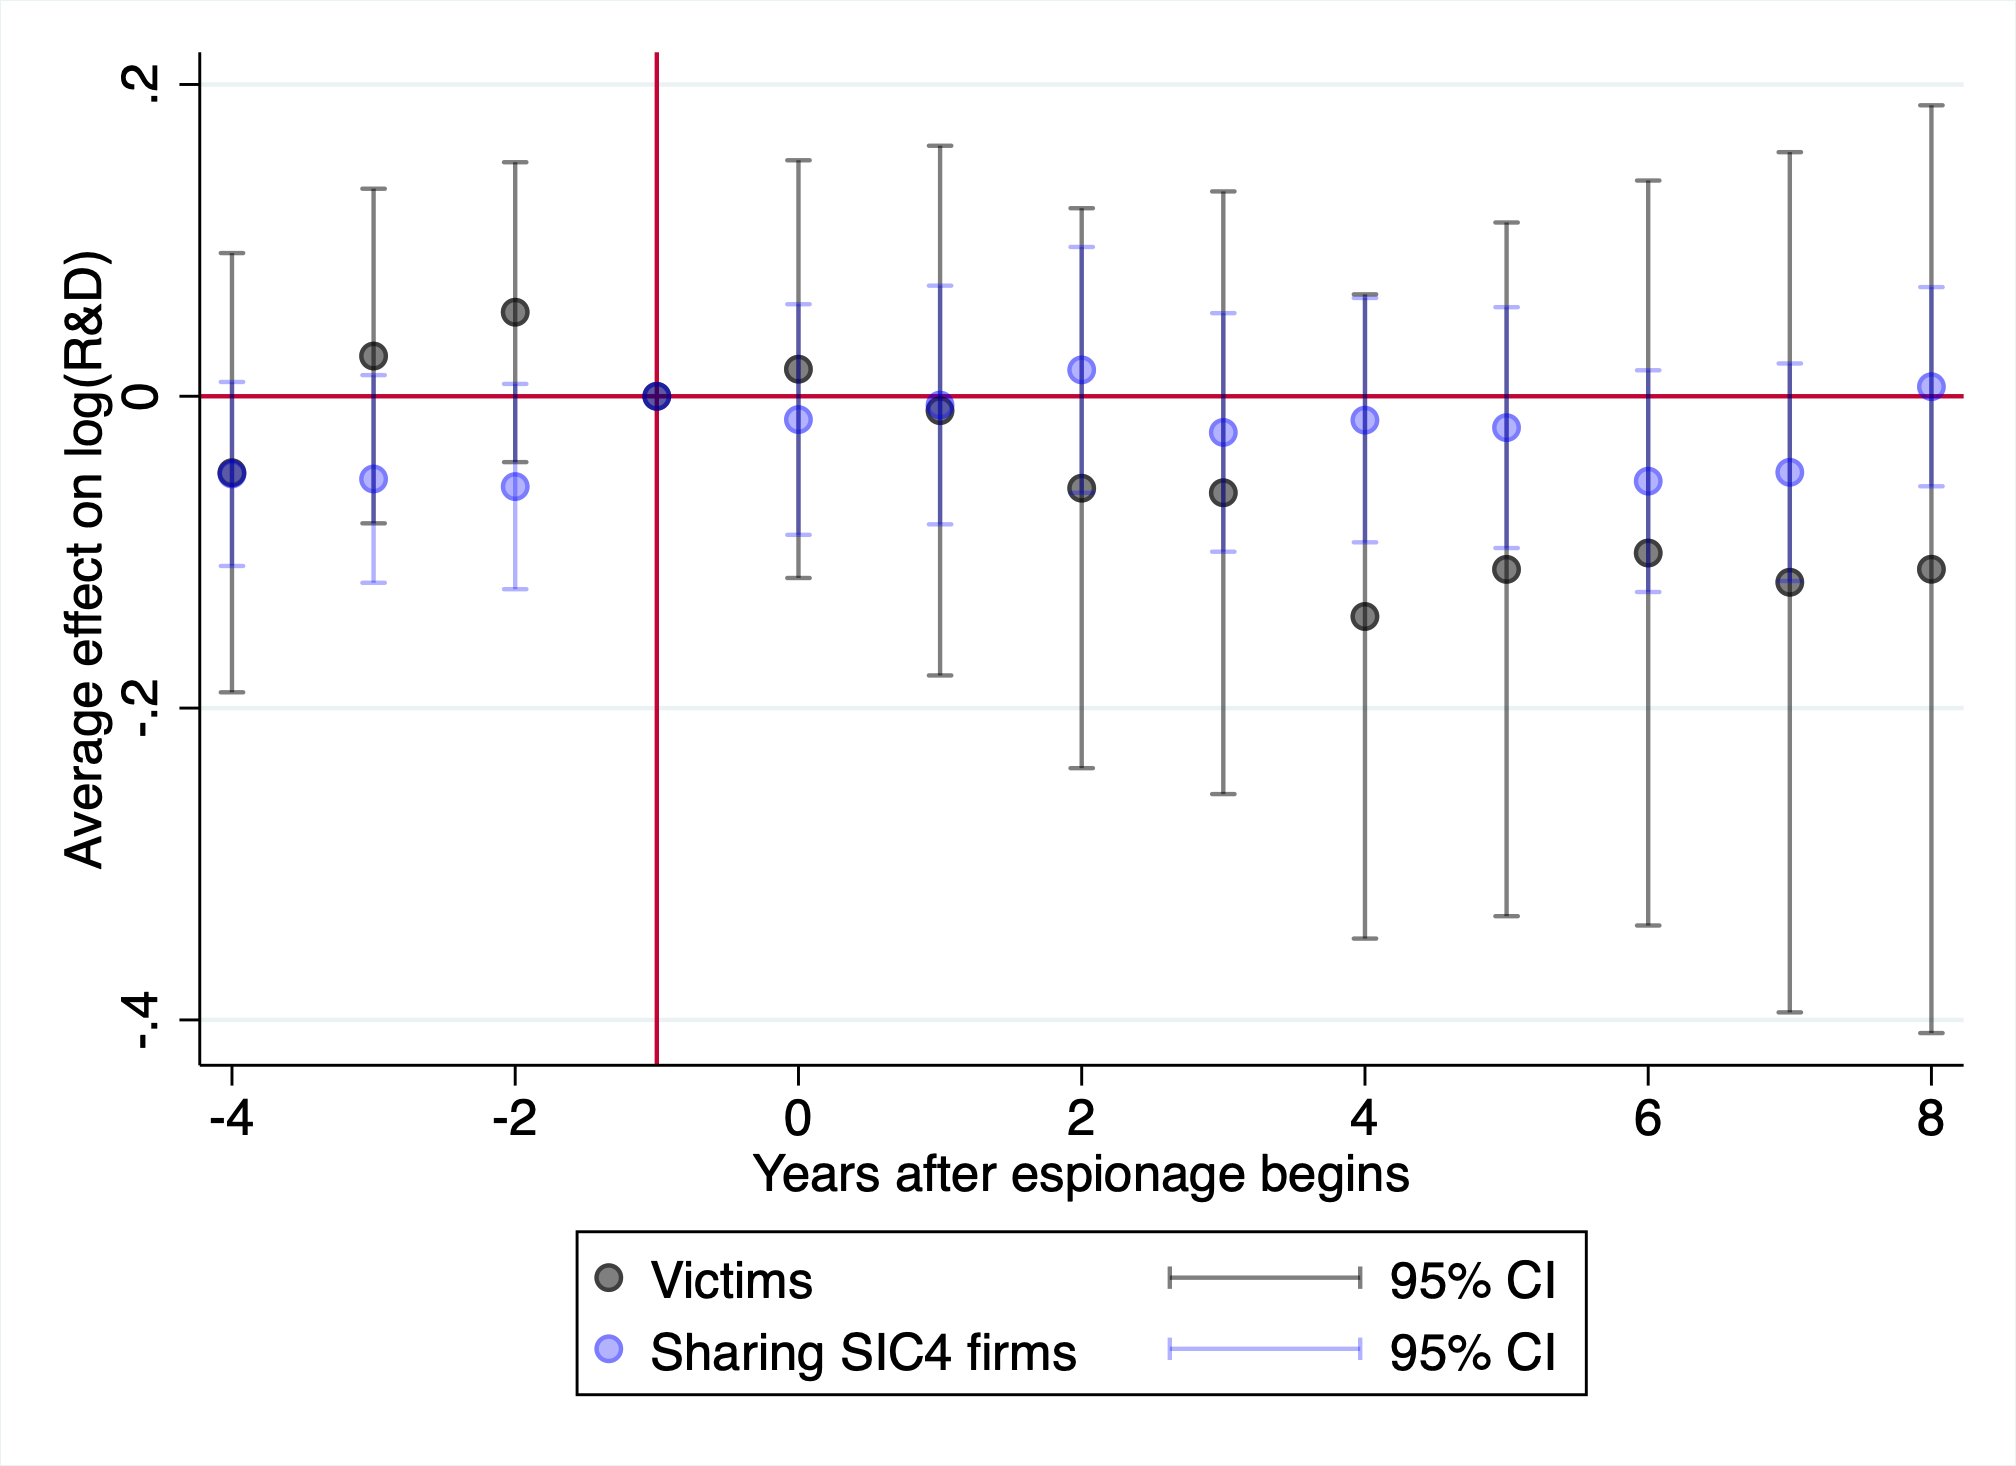
Panel B: Unsuccessful cases
Panel B.1: log(Revenue) Panel B.2: log(R&D)
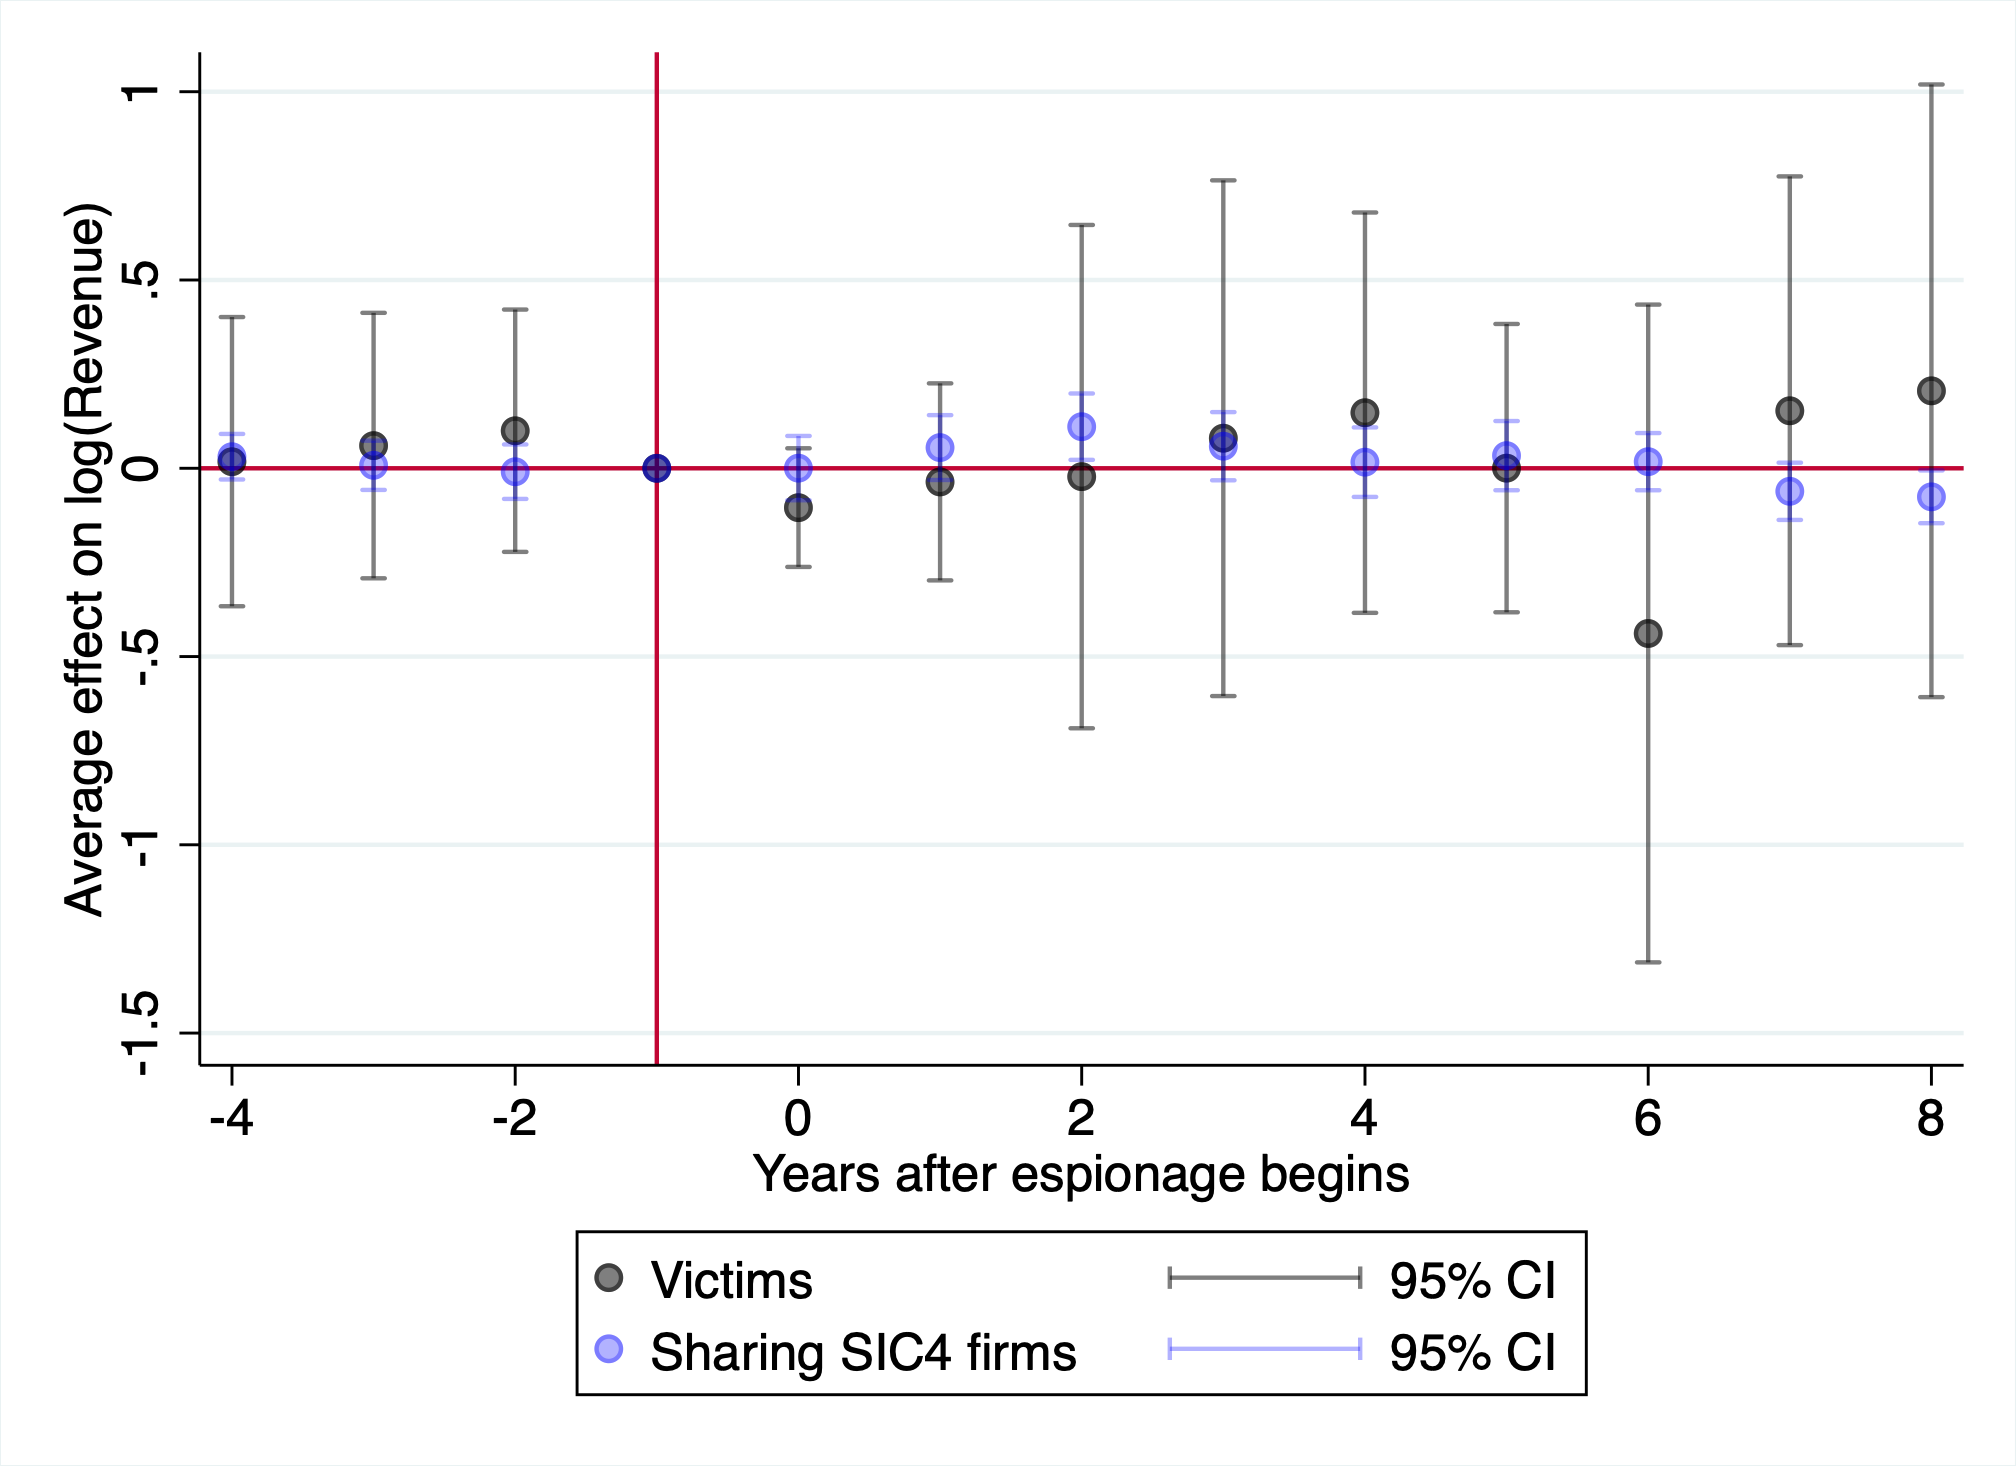
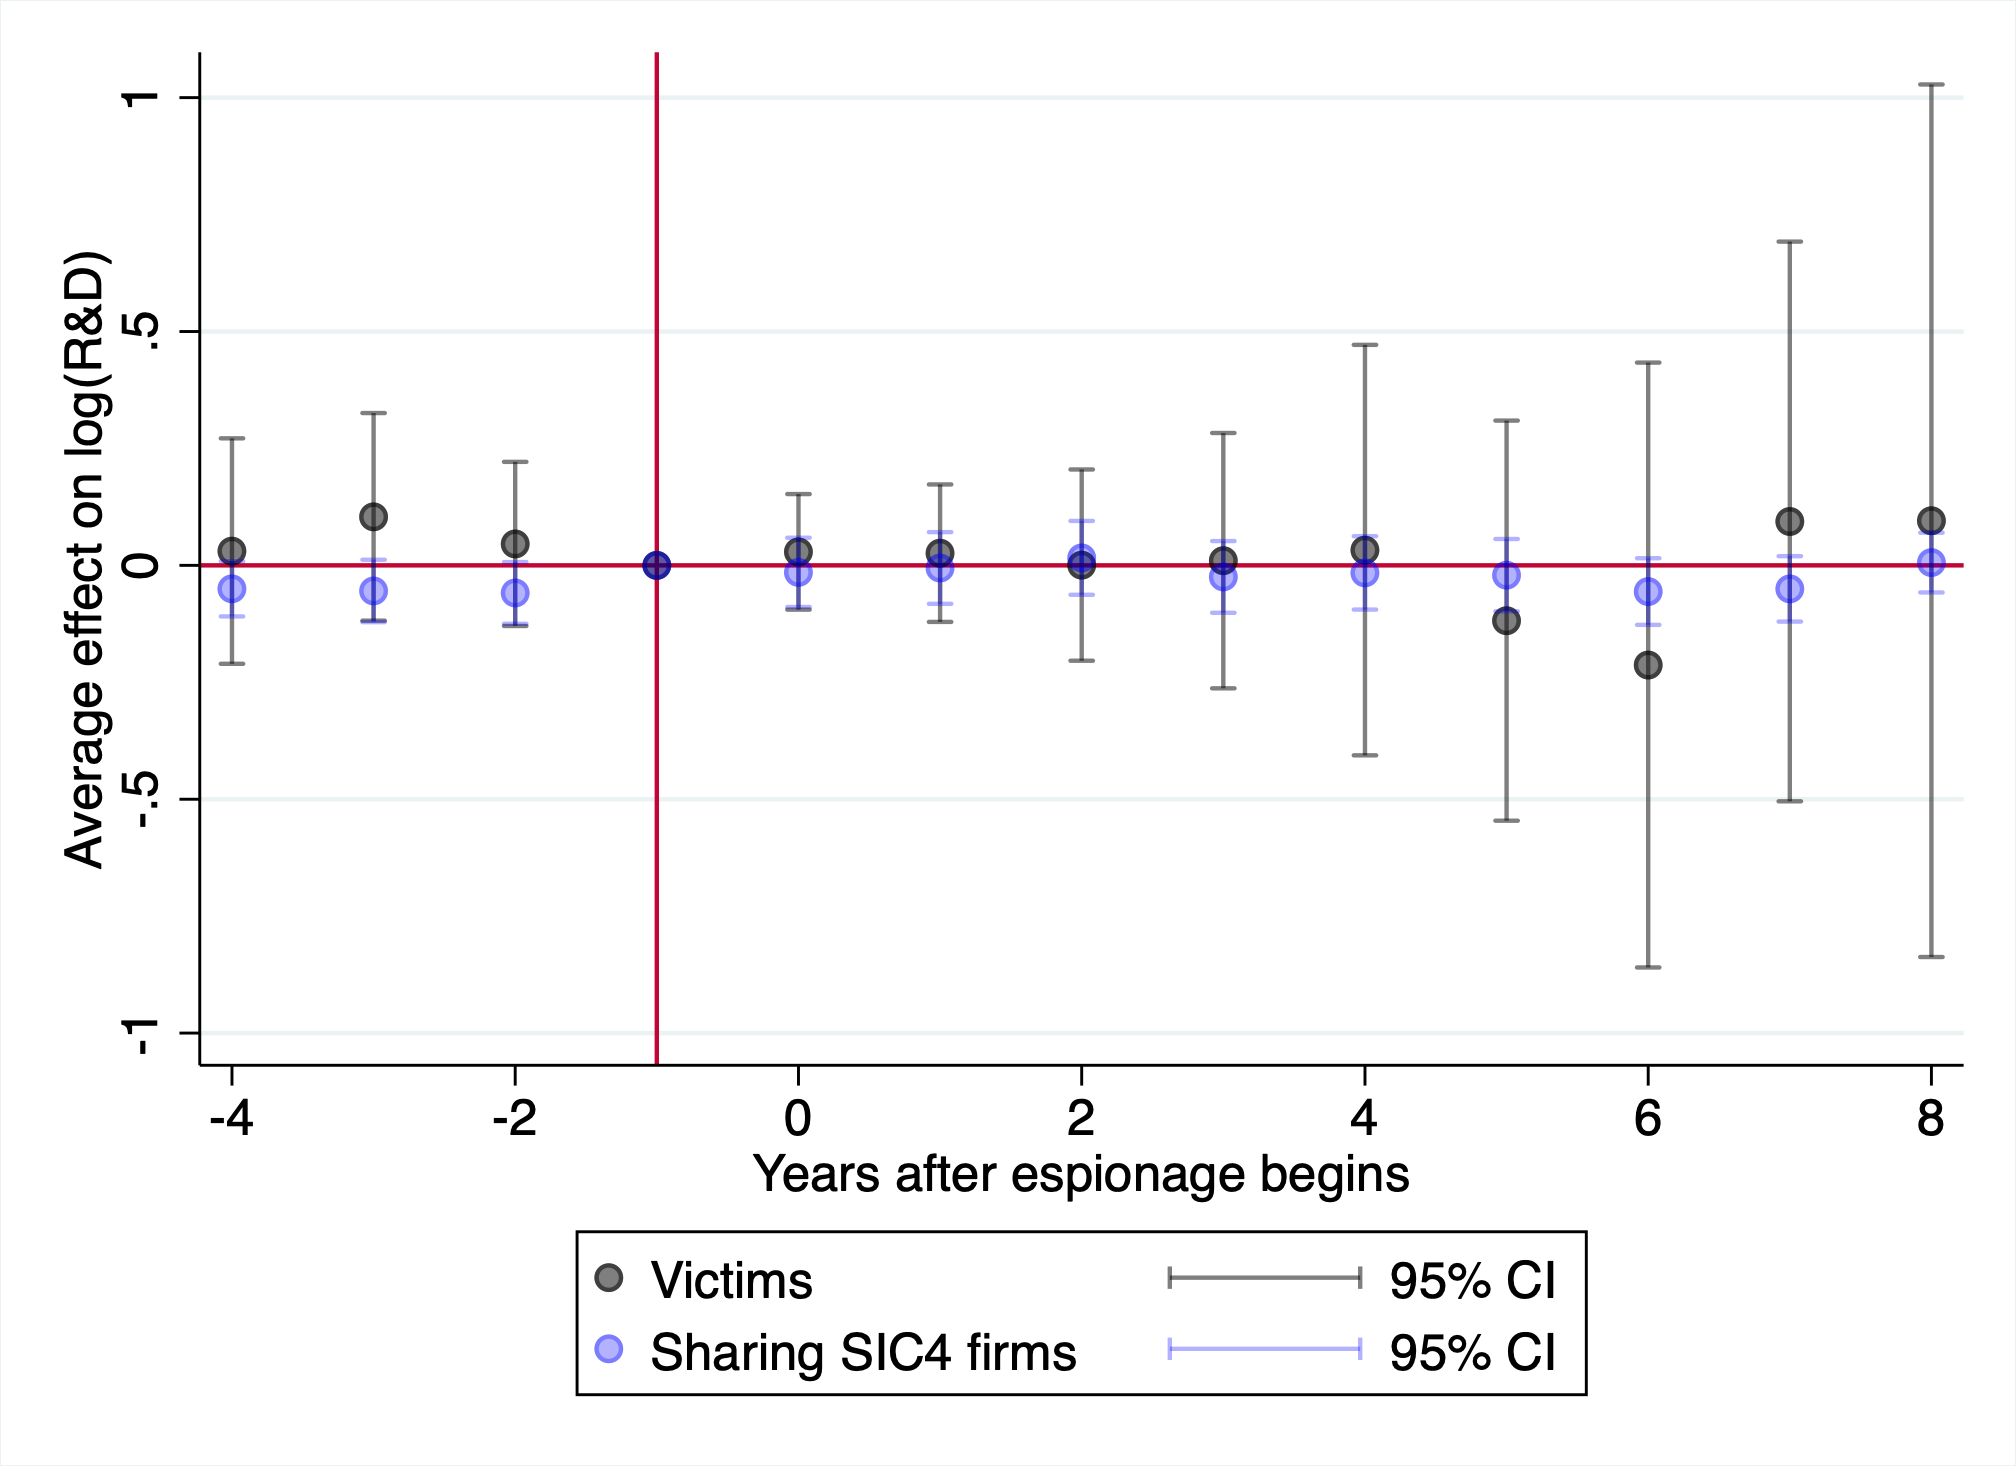
Note: This figure plots coefficients and 95% confidence intervals from a triple difference two-way fixed effects event study regression. In Panel A, an event is the first time an industry is successfully targeted for economic espionage. In Panel B, events are unsuccessful cases of economic espionage, where the desired information was not successfully given to its intended recipient. The outcome in Panels A.1 and B.1 is a firm’s log(Revenue) and in Panels A.2 and B.2, a firm’s log(R&D expenditures). The sample consists of all firms in treated industries (SIC-4 codes ever targeted for espionage) and “nearby” never-treated industries (industries sharing an SIC-3 code with treated SIC-4 industries). Coefficients for event-time indicators are plotted in blue, while triple difference coefficients for victim firms are plotted in black. Standard errors are clustered at the firm level.
Panel A: log(China exports) Panel B: log(non-China
exports)
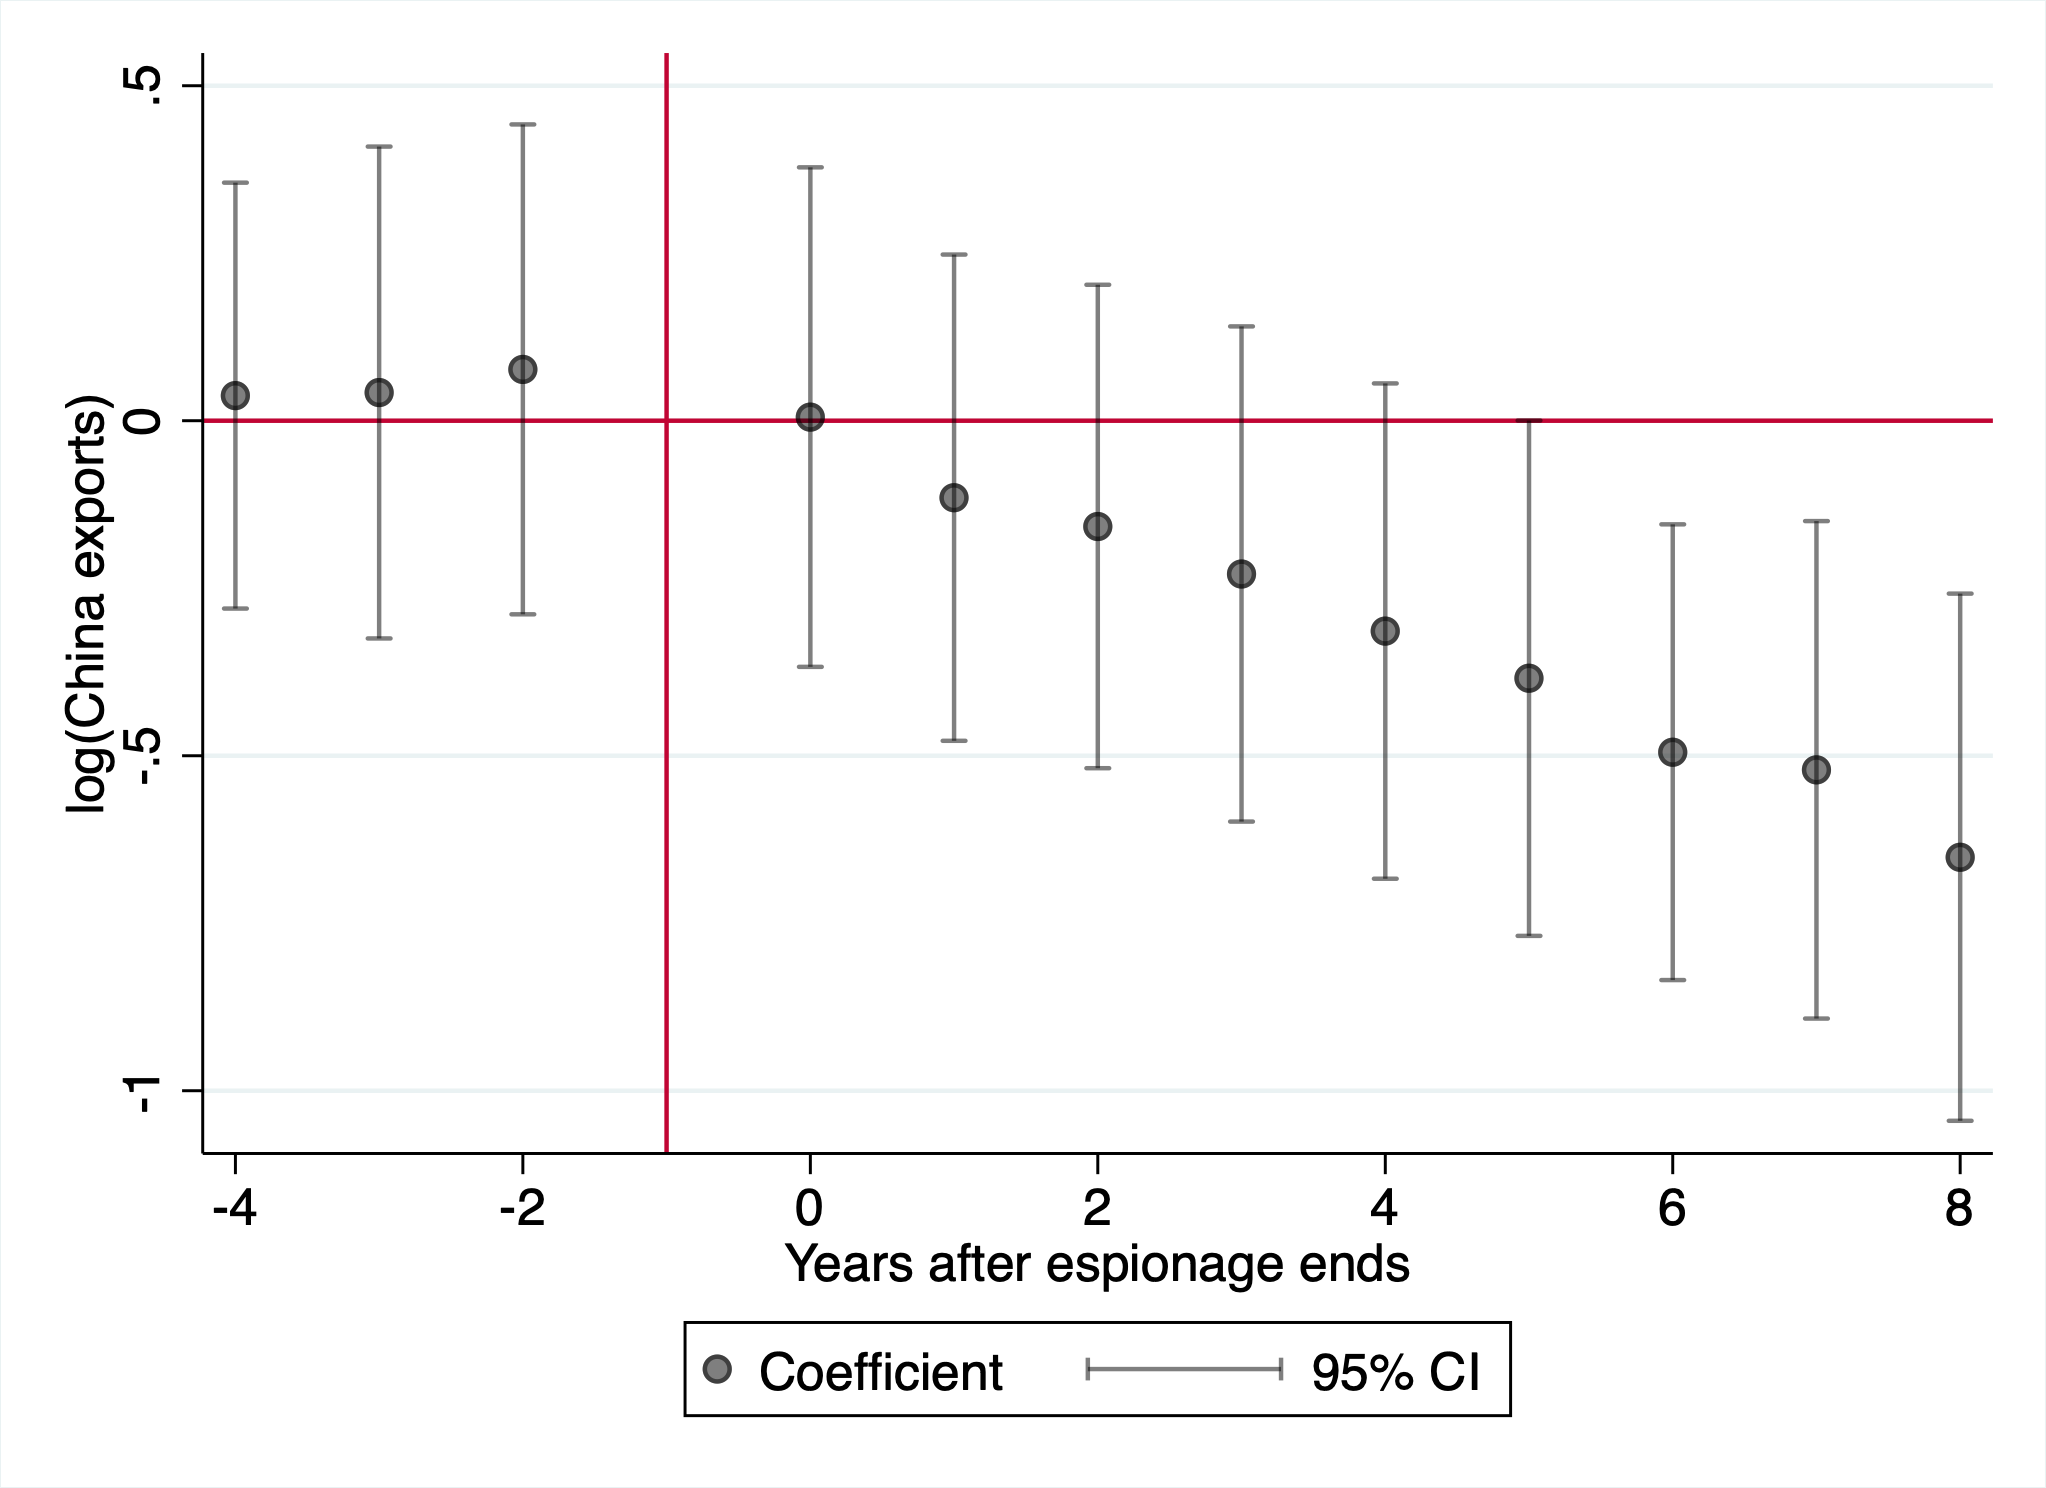
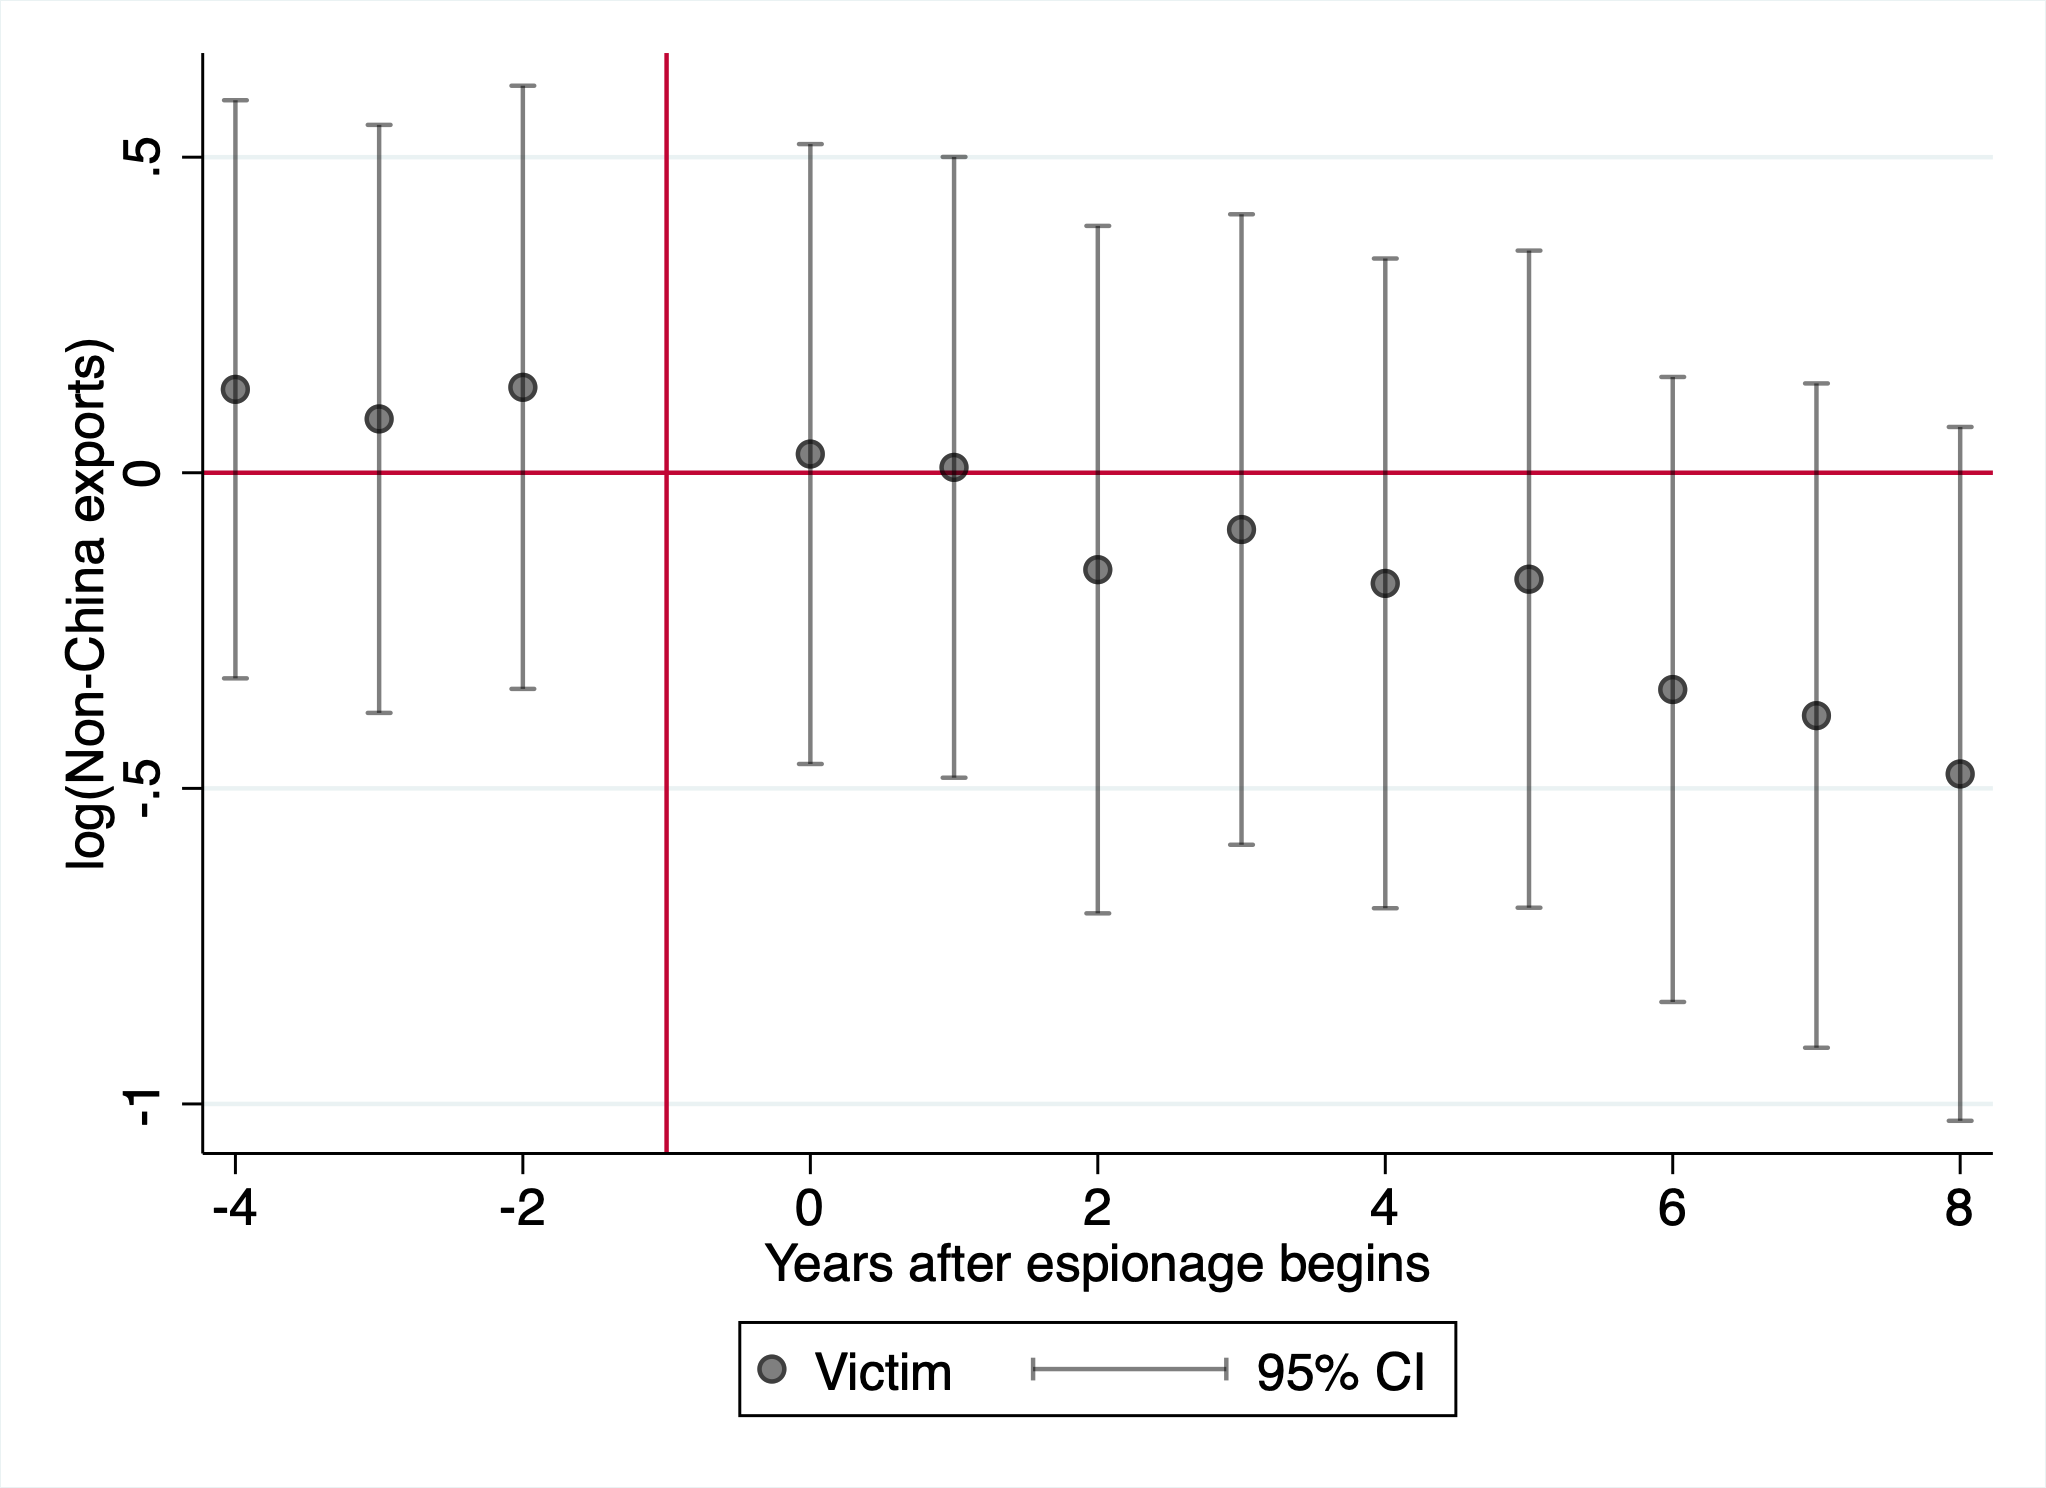
Panel C: log(Domestic sales)
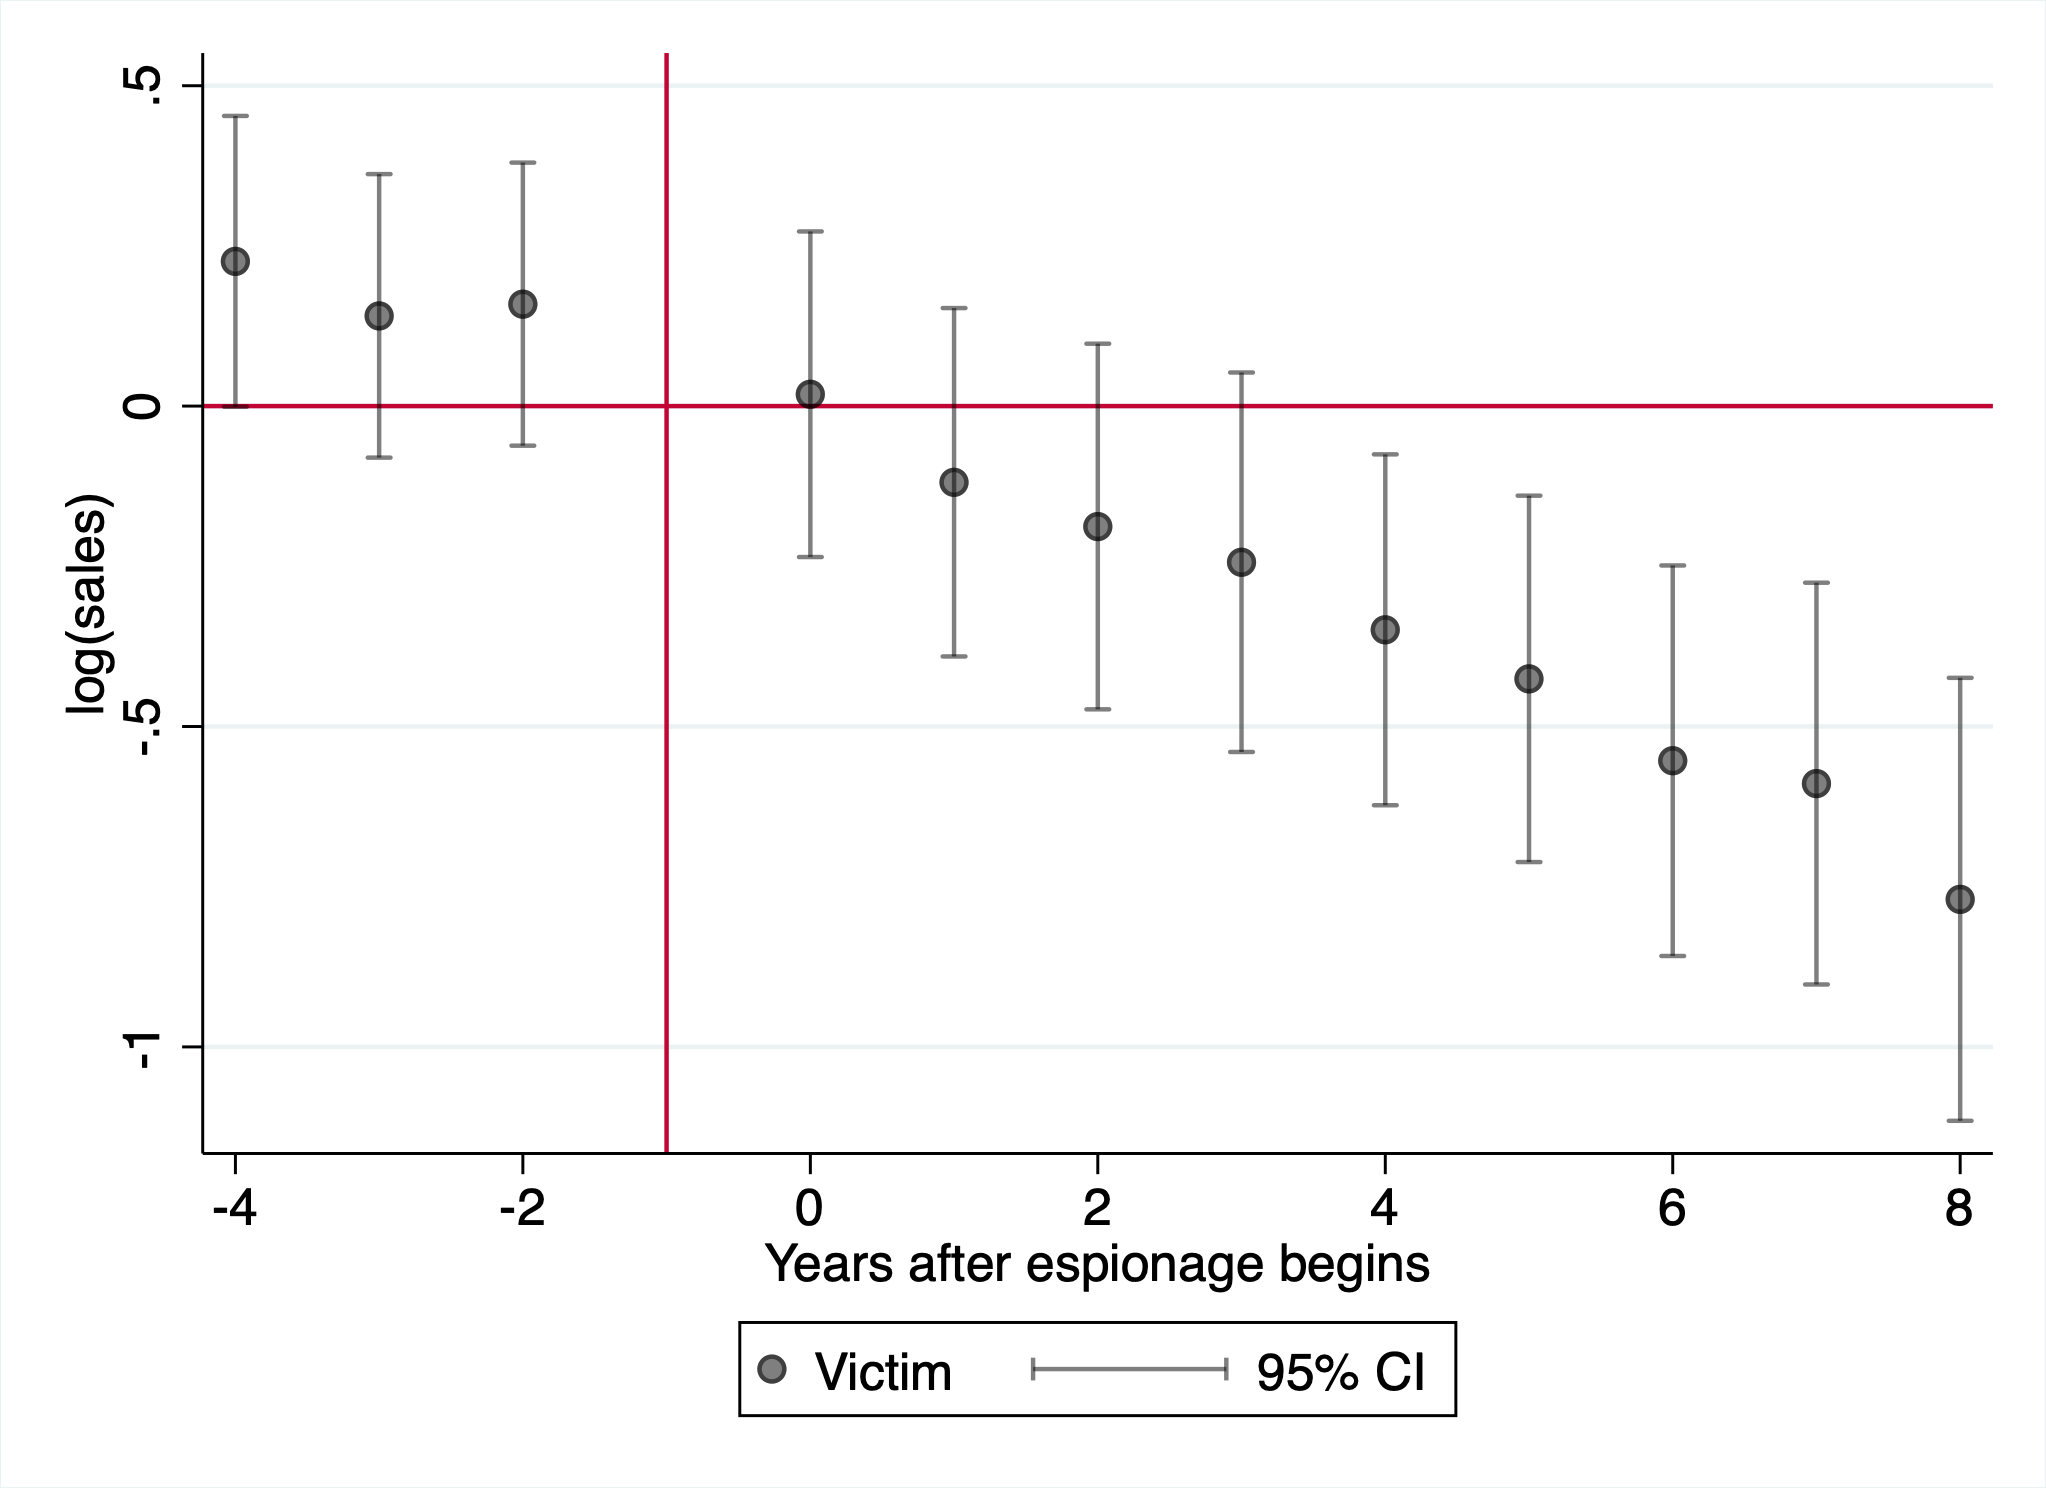
Note: This figure plots coefficients and 95% confidence intervals from a two-way fixed effects event study regression. An event is a firm being successfully targeted for economic espionage. The outcome in Panel A is a firm’s log(China exports), in Panel B a firm’s log(non-China exports), and in Panel C a firm’s log(Domestic sales). The unit of analysis is a firm by year. Standard errors are clustered at the firm level.
Panel A: Successful cases
Panel A.1: After espionage begins Panel A.2: After publicly
announced
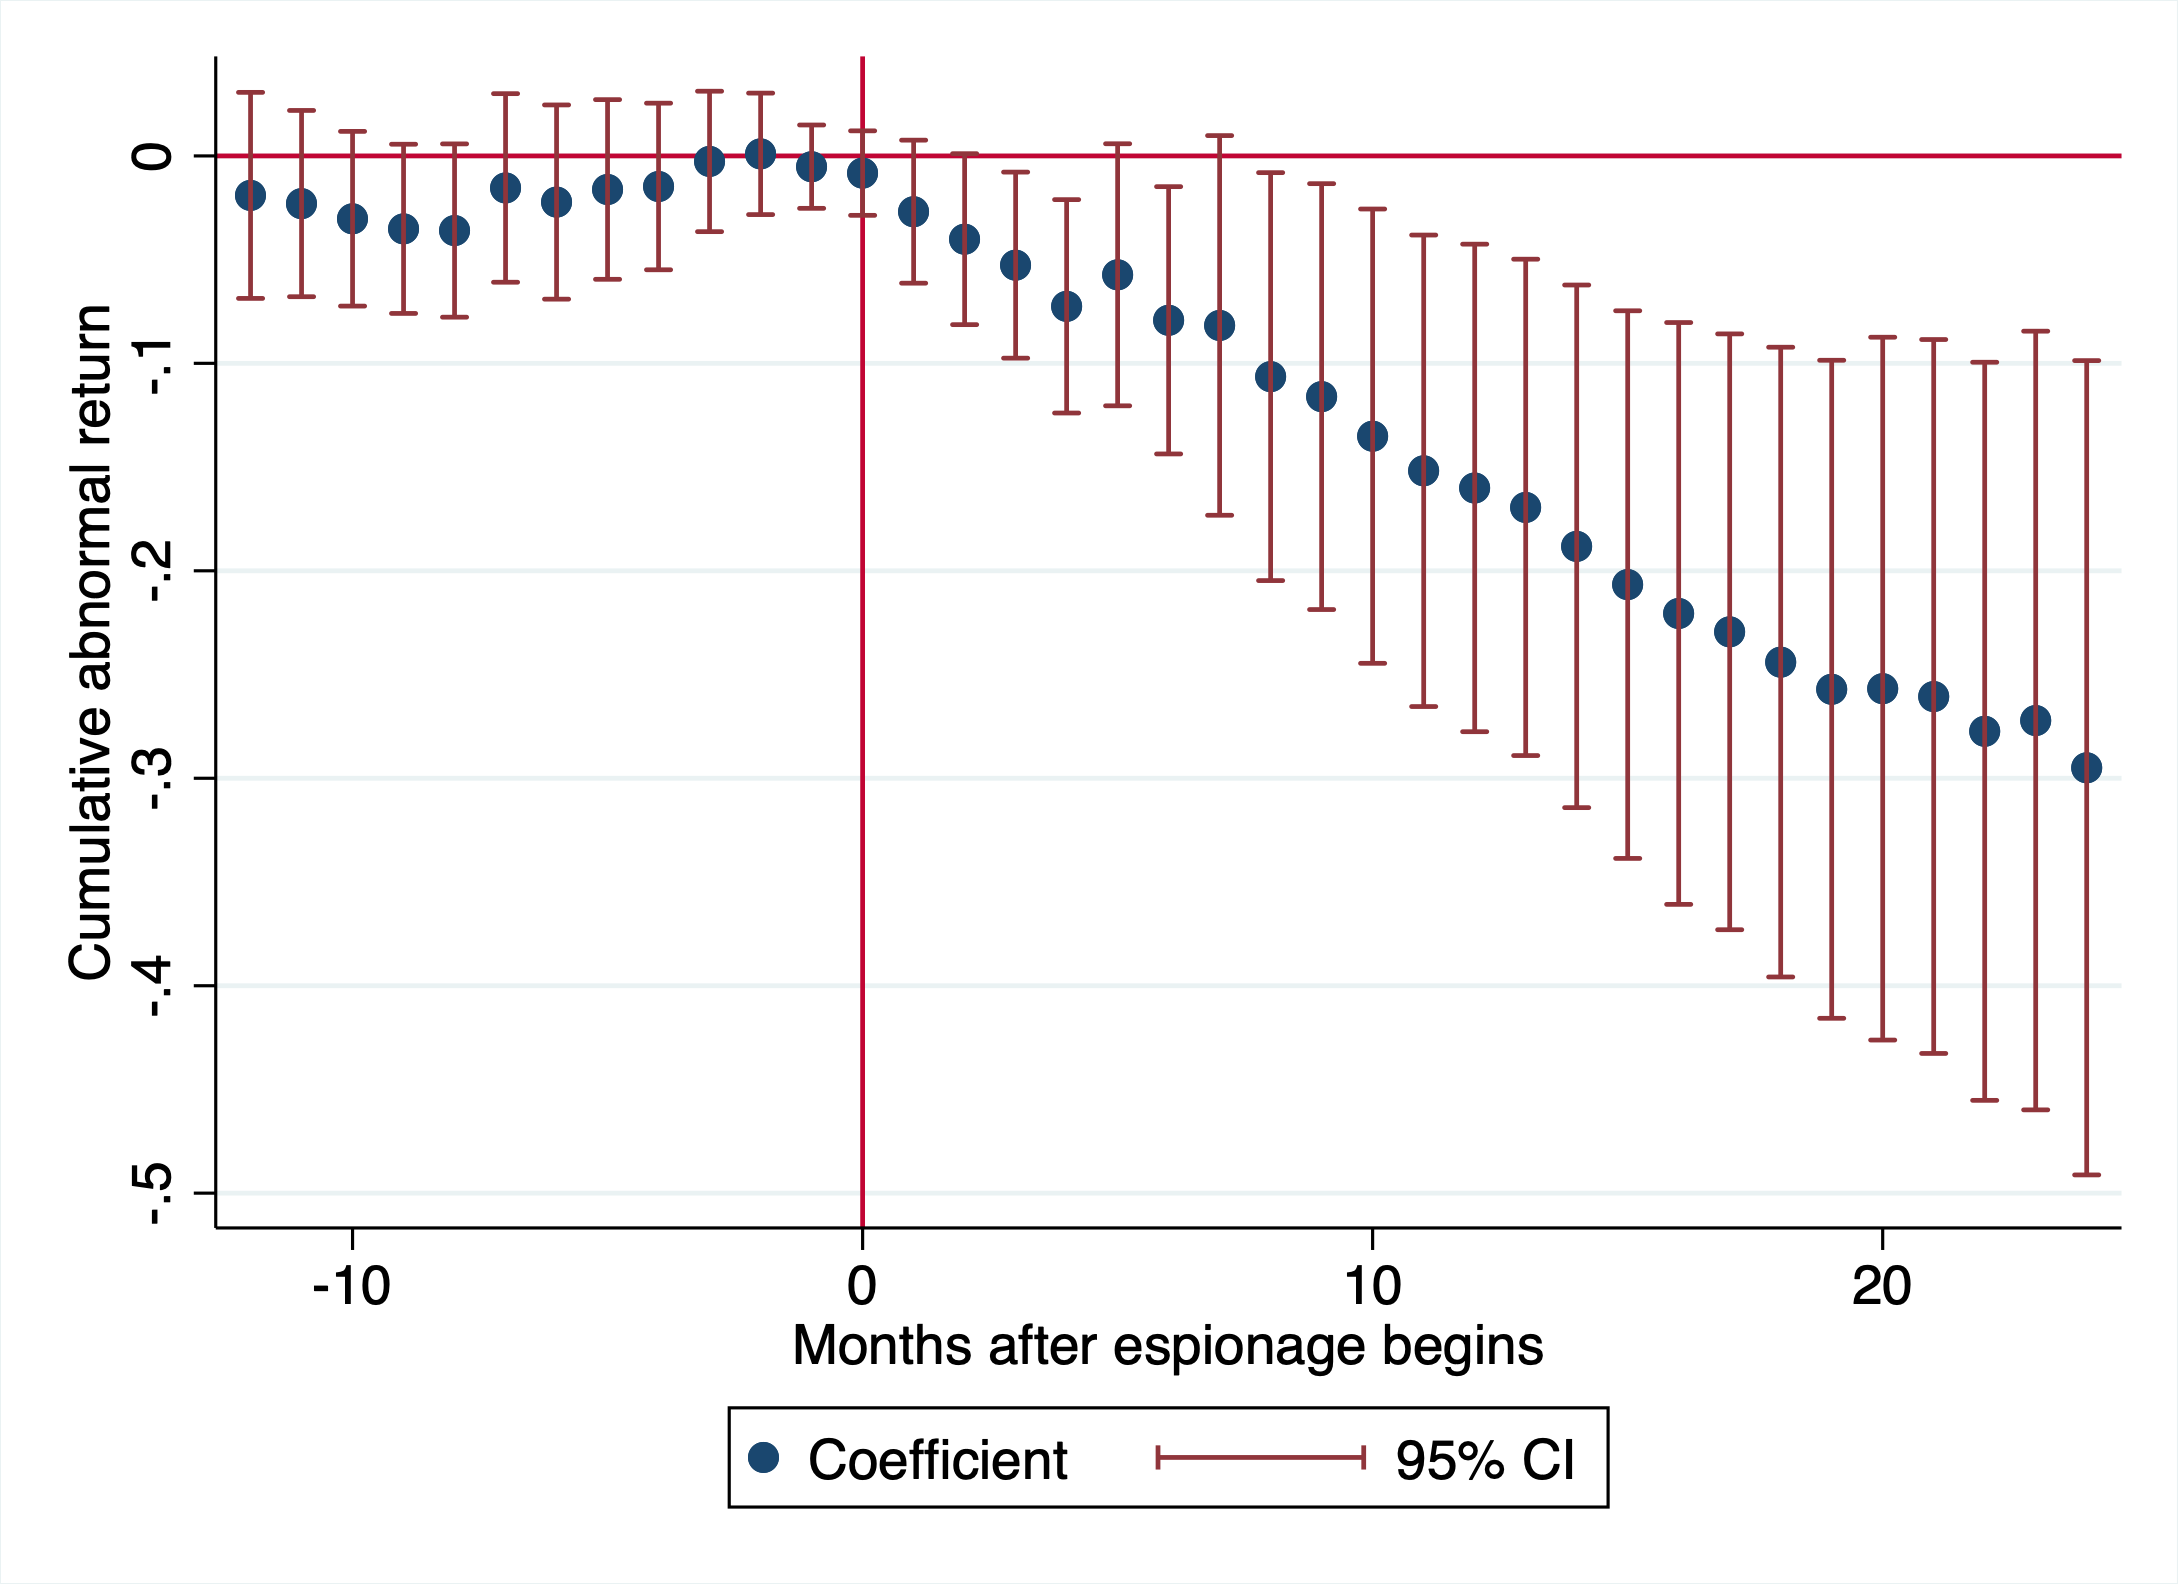
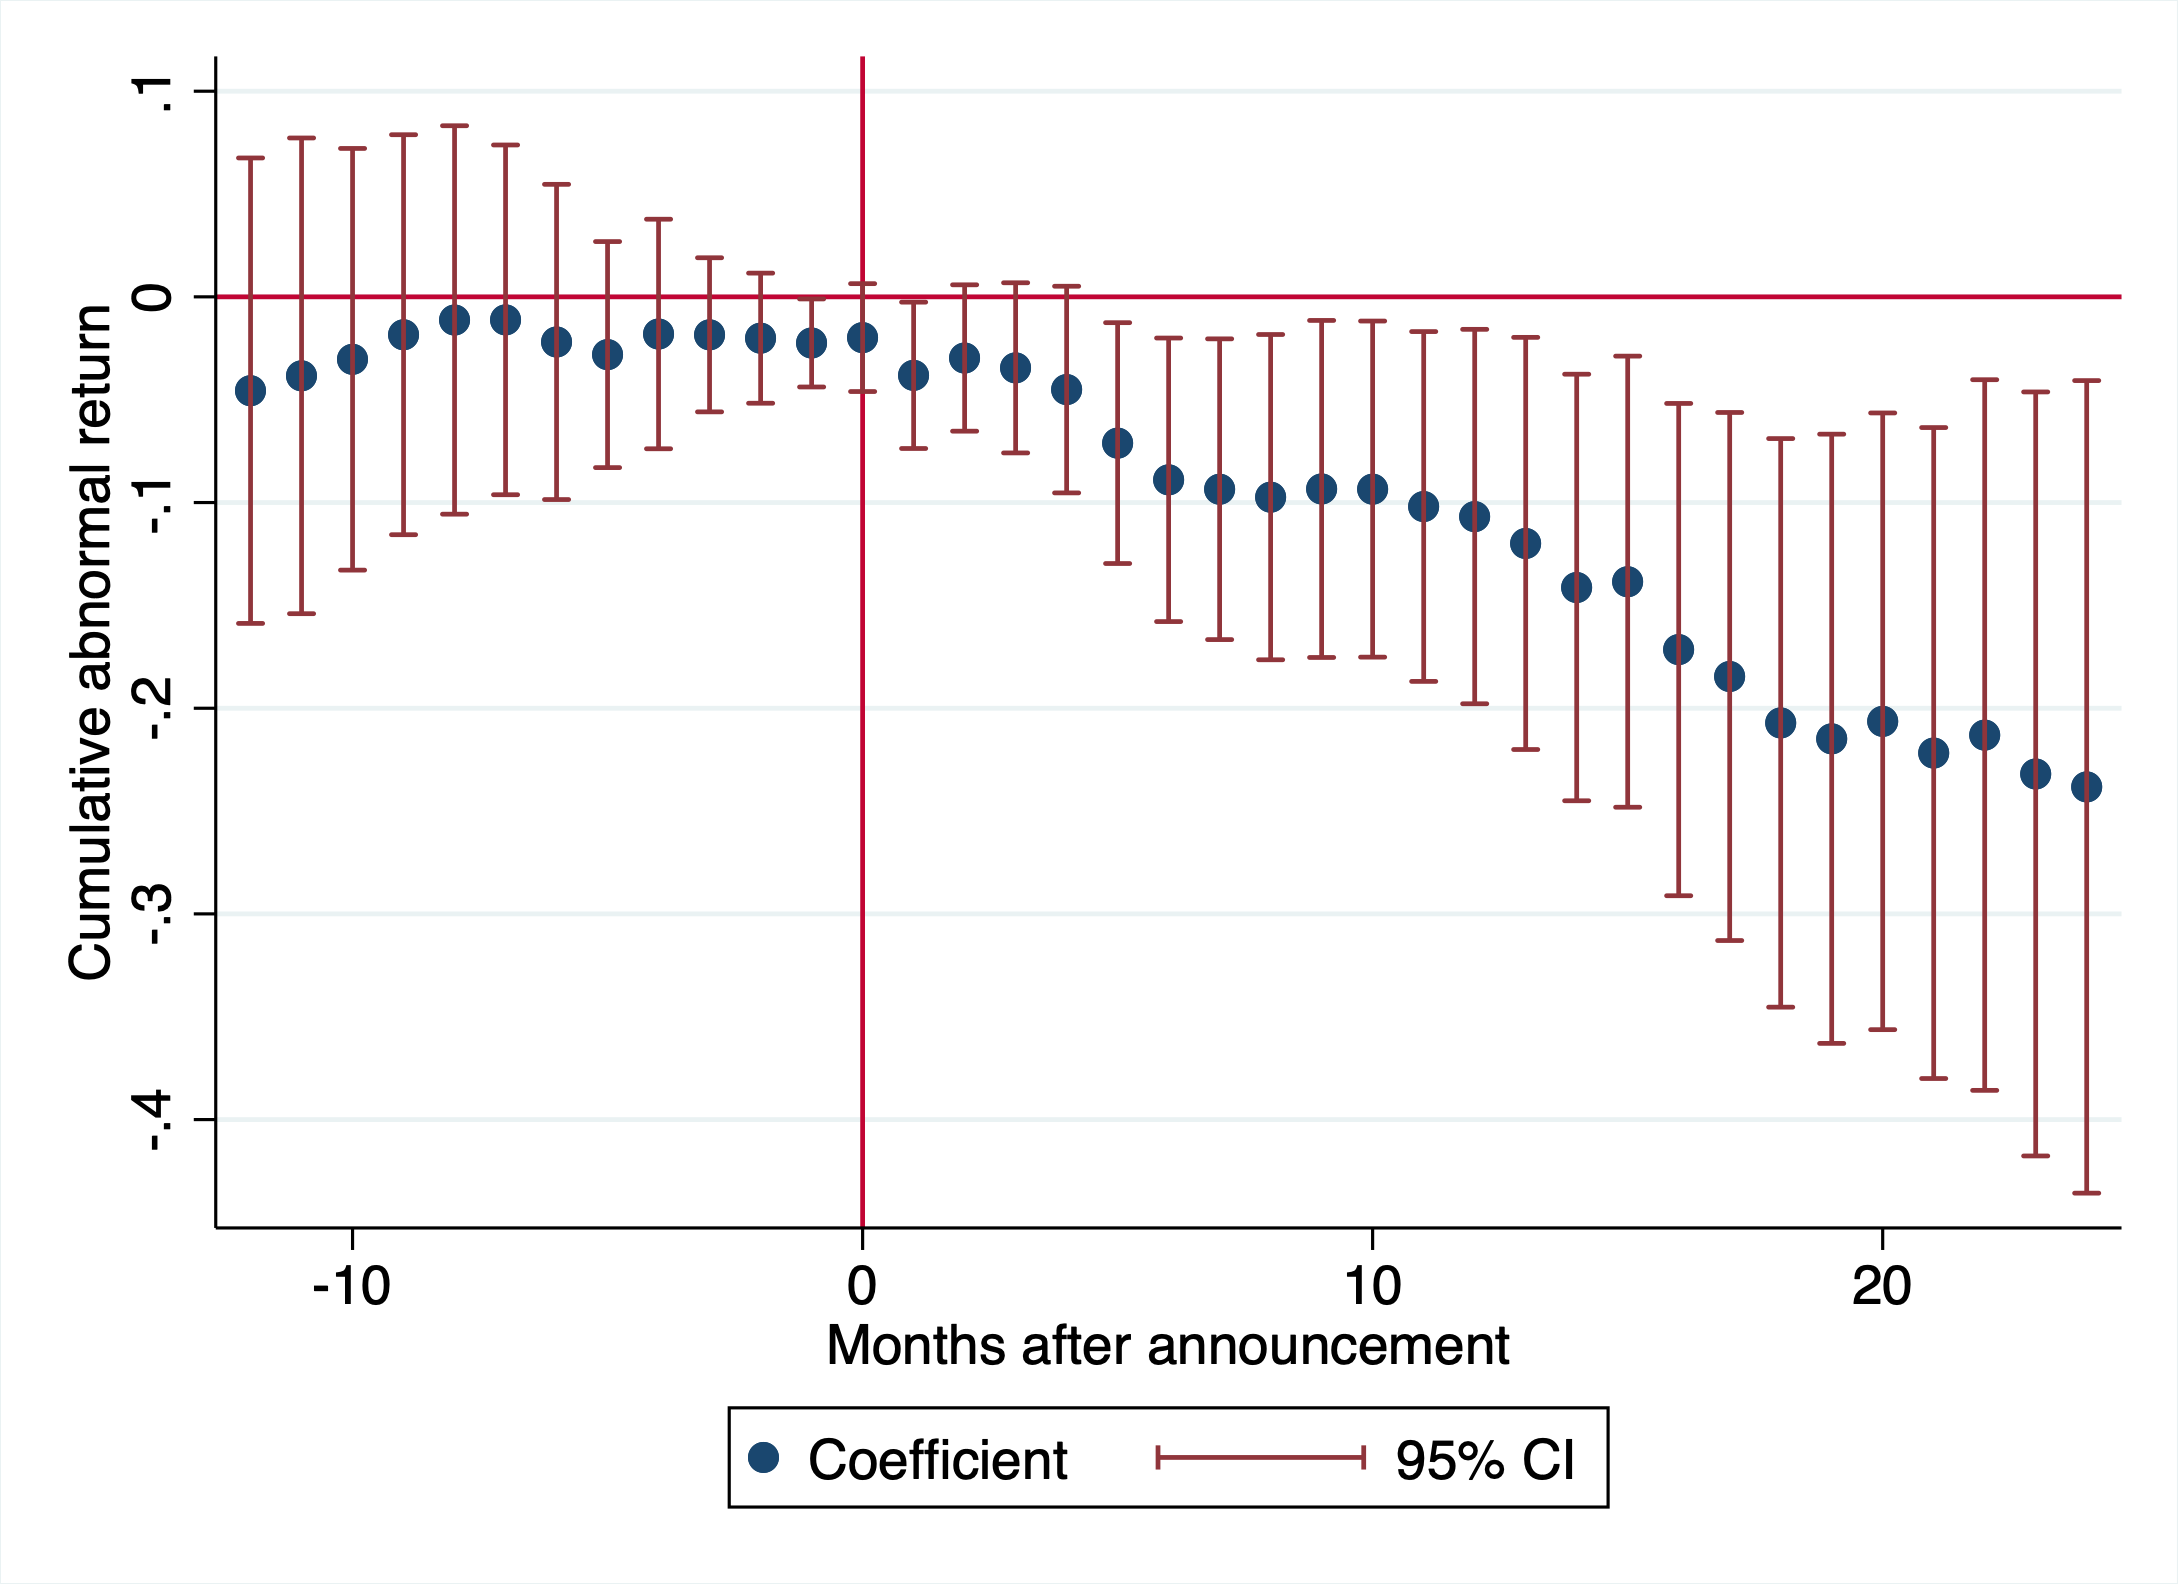
Panel B: Unsuccessful cases
Panel B.1: After espionage begins Panel B.2: After publicly
announced
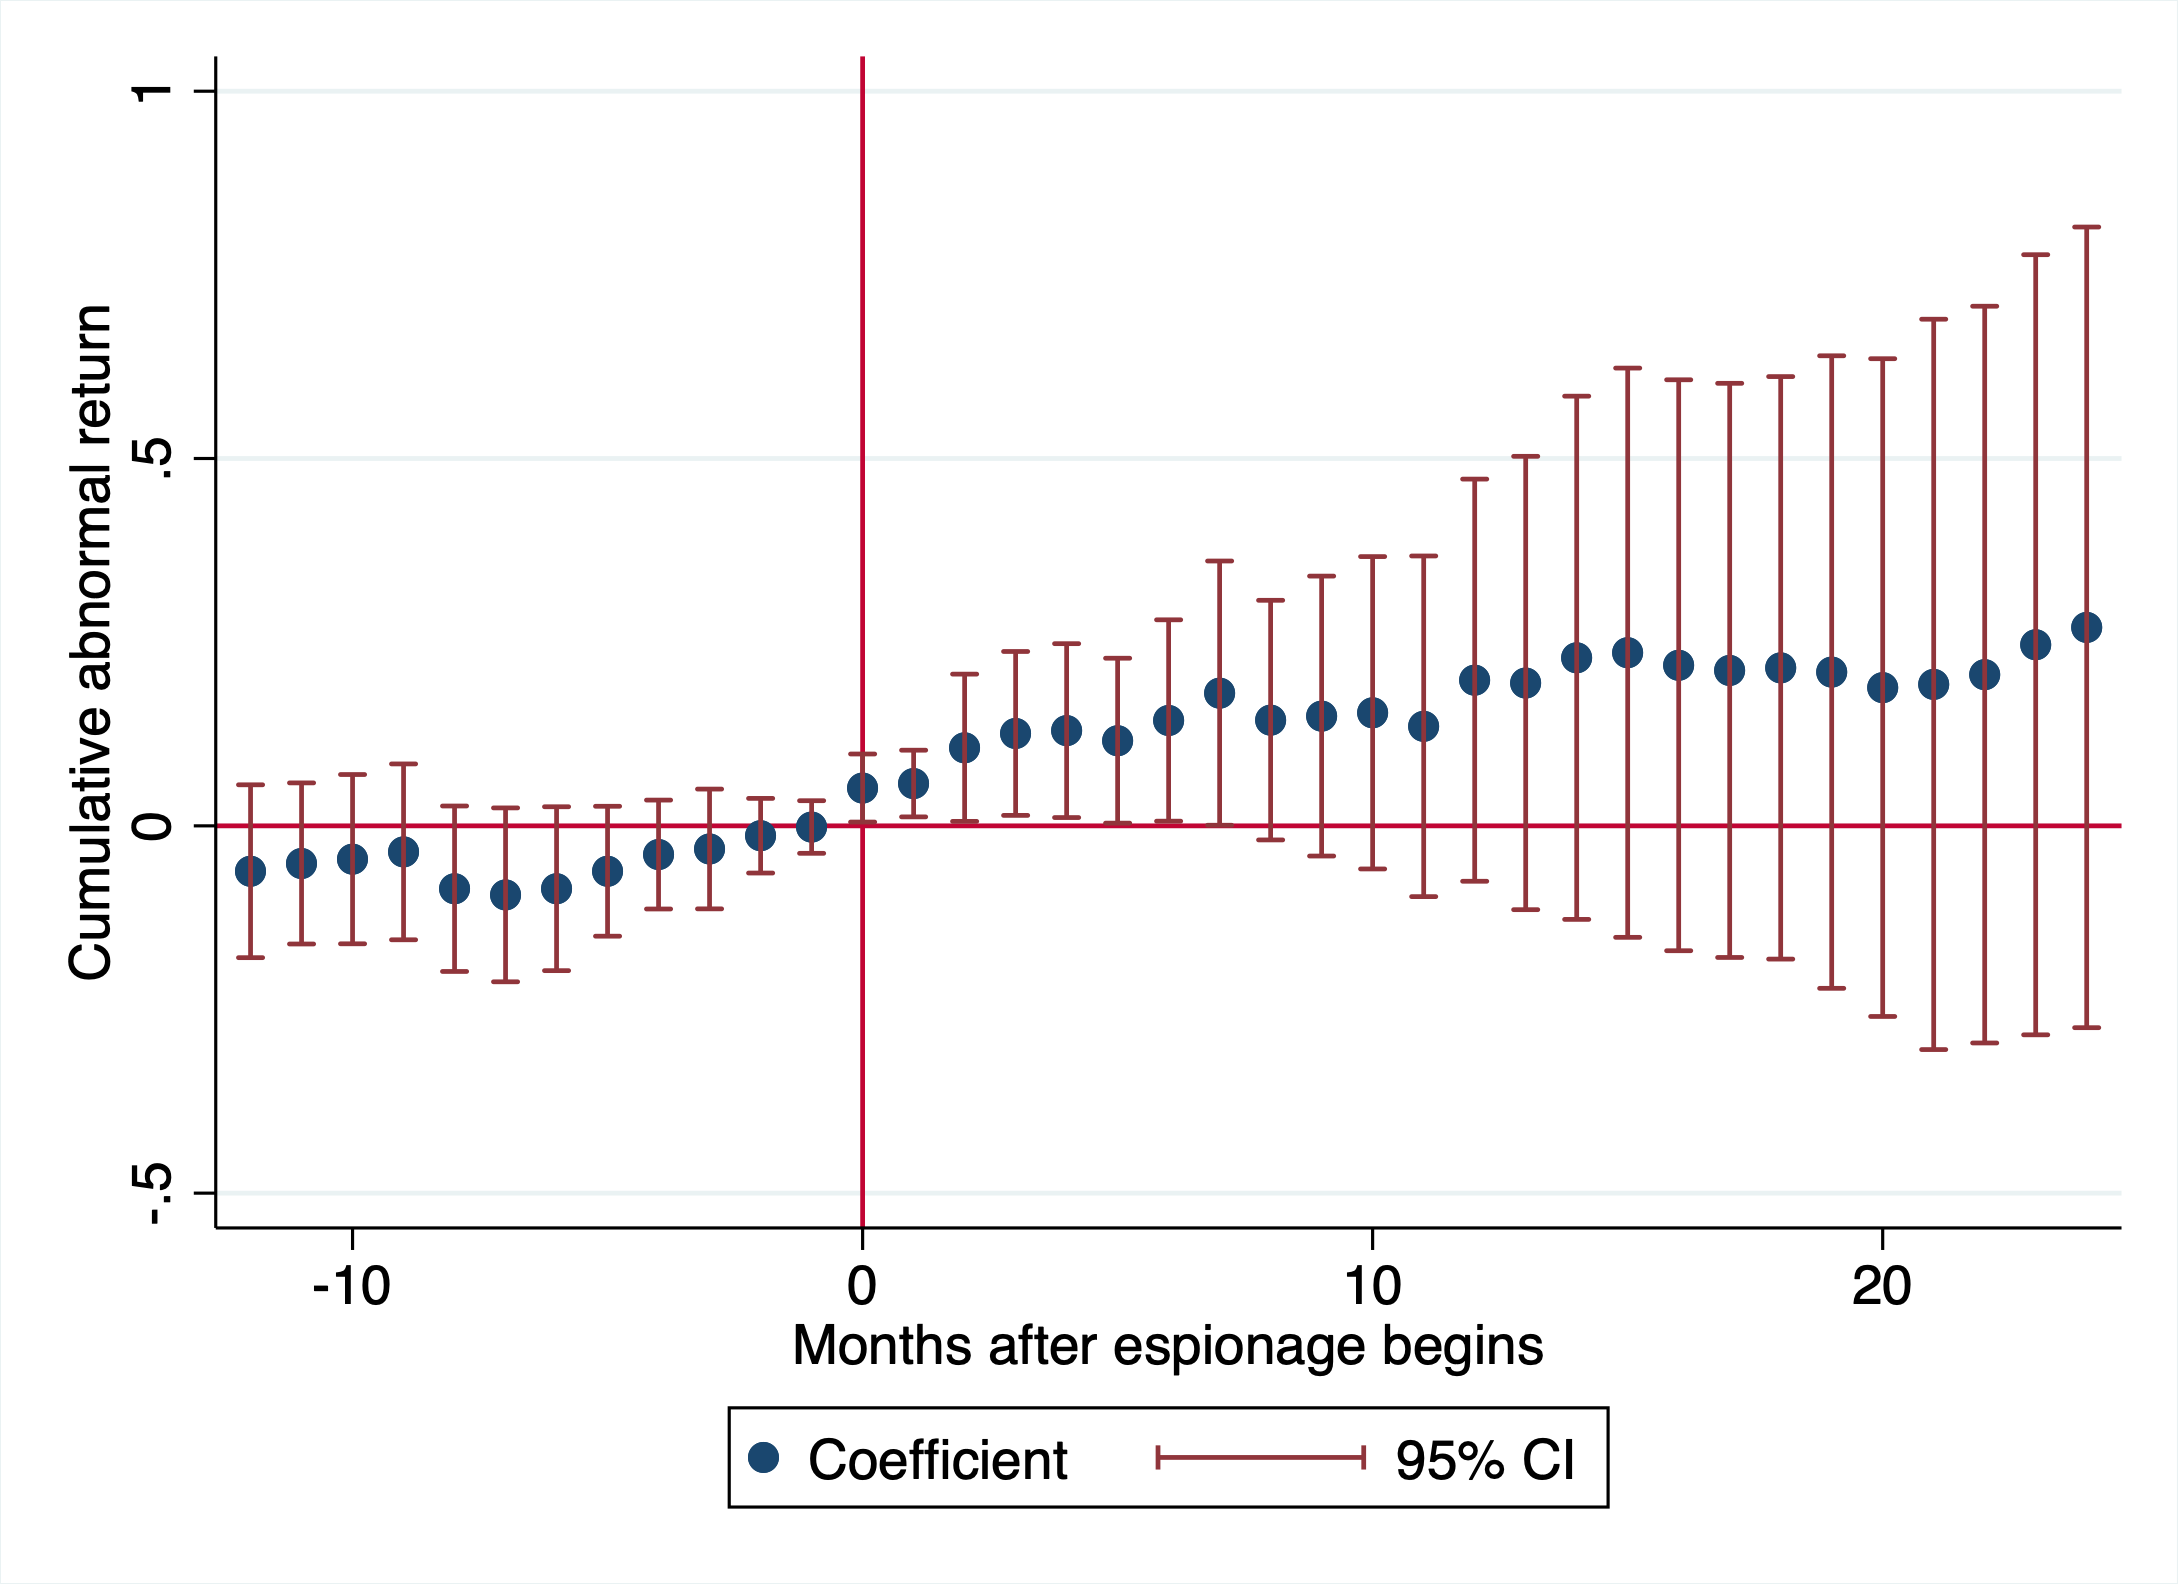
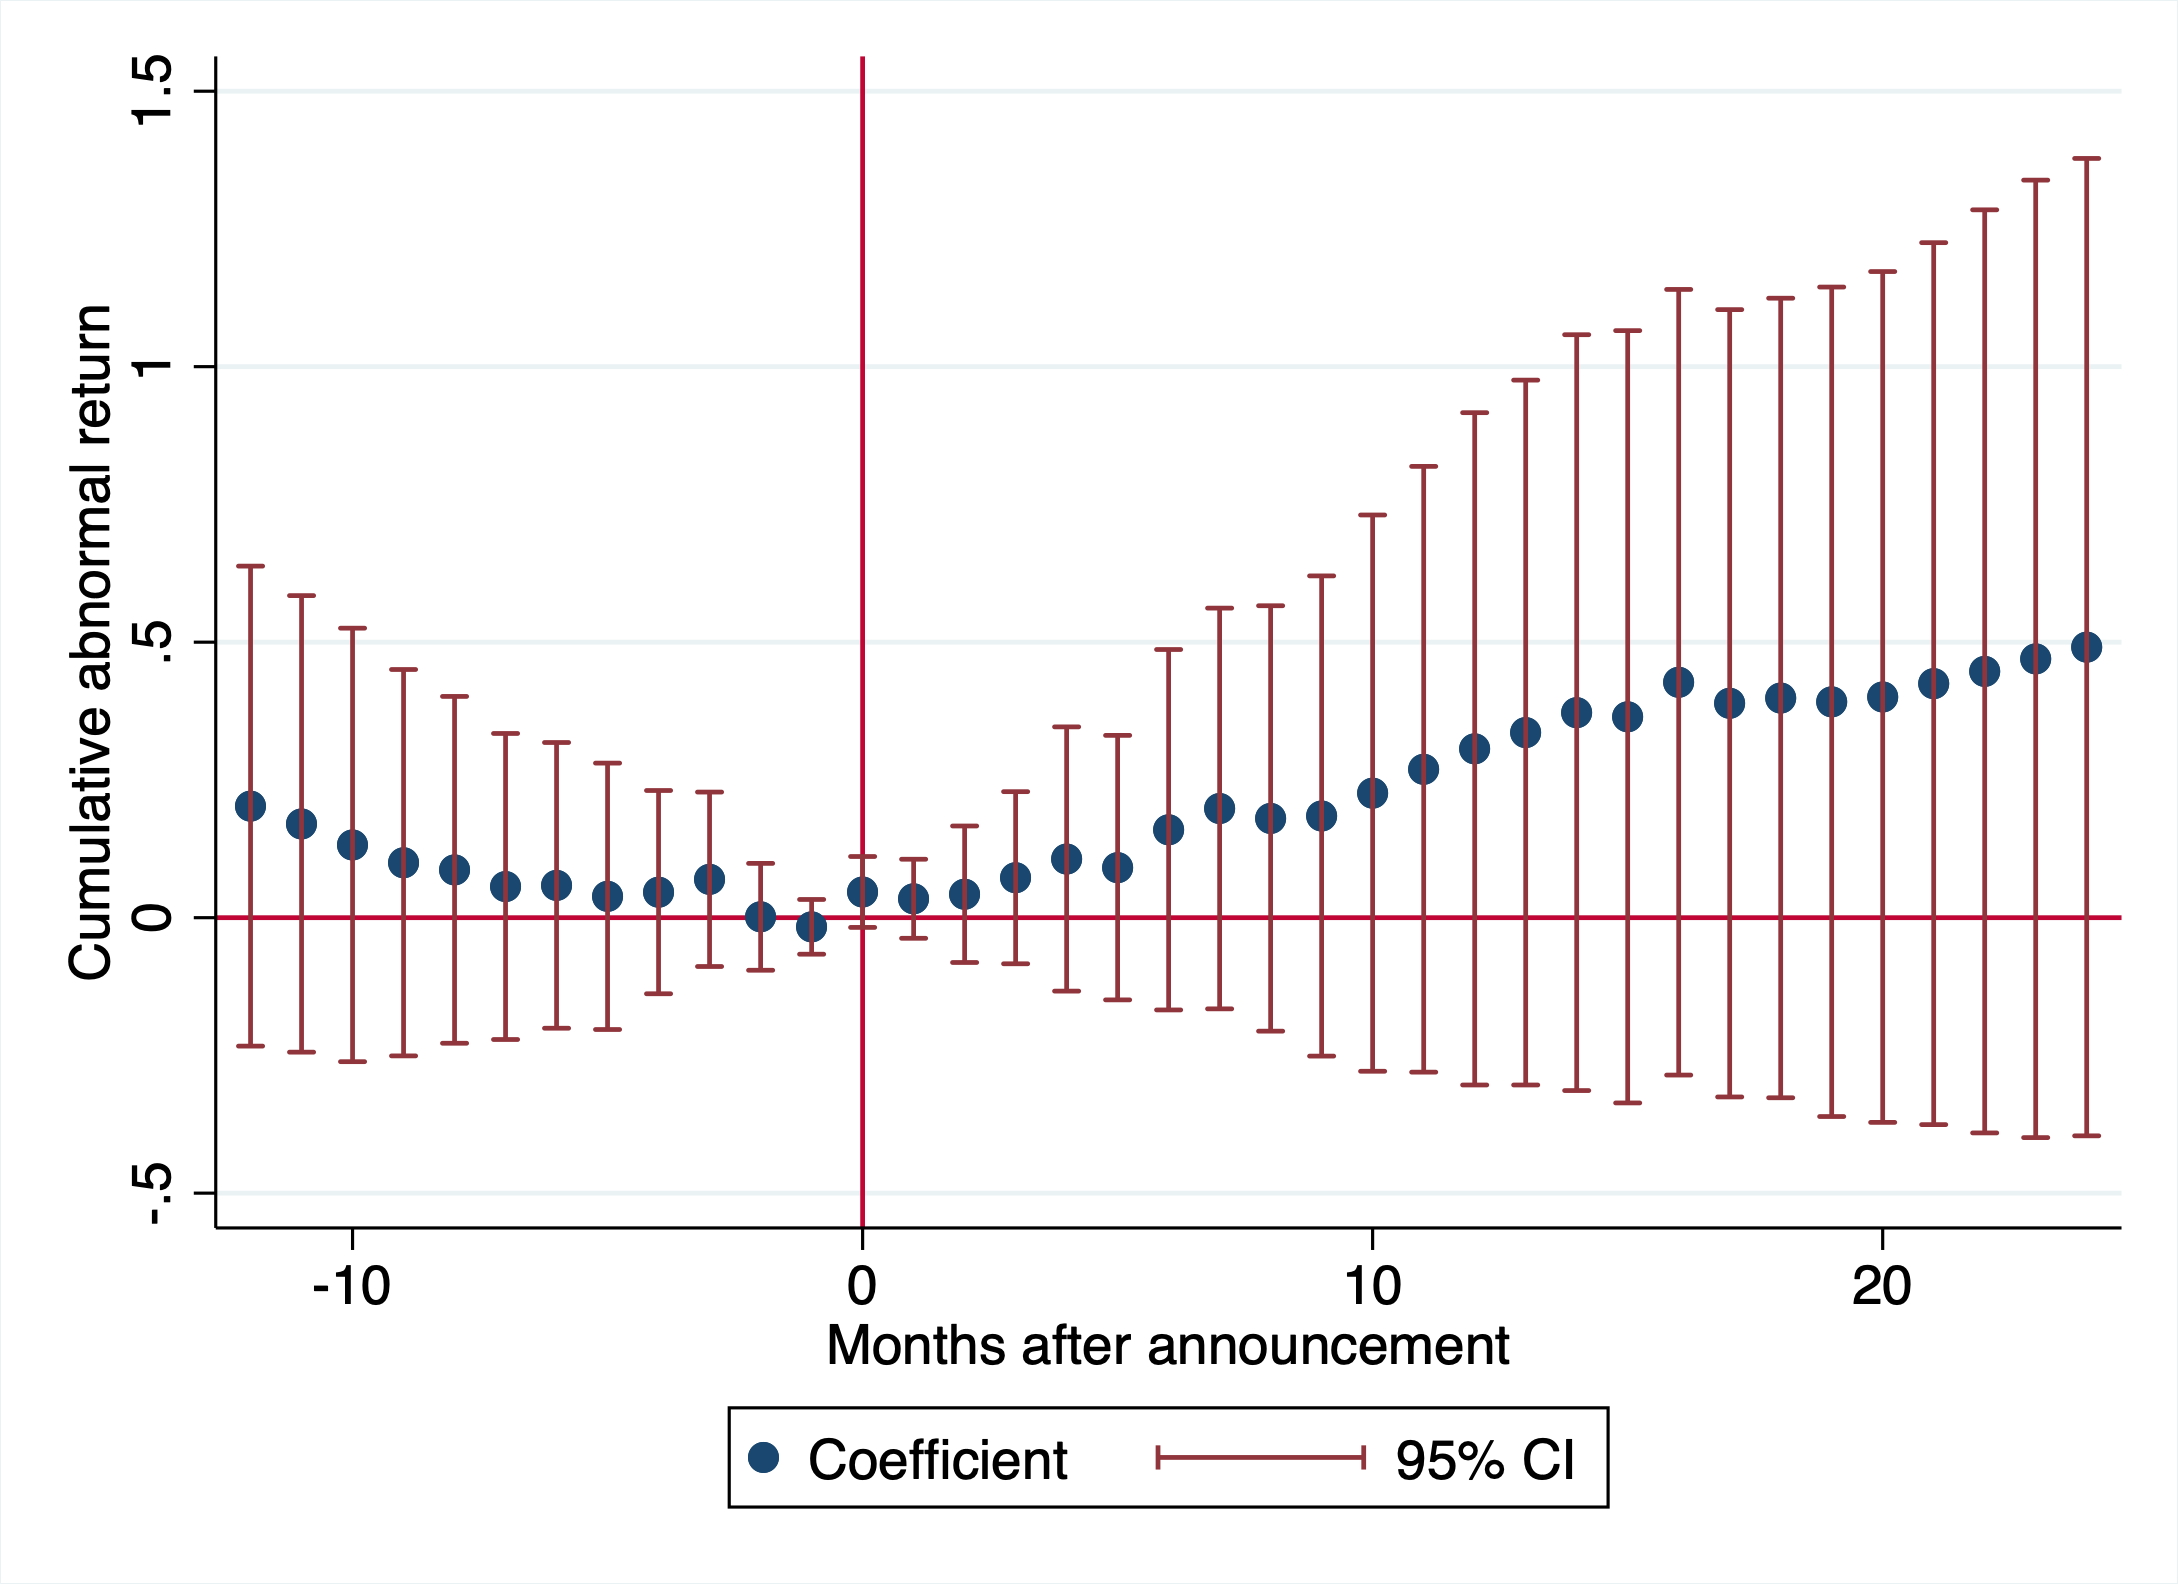
Note: This figure plots coefficients and 95% confidence intervals from regressions on victim firms of economic espionage at various time horizons. In Panel A, an event is a firm being successfully targeted for economic espionage. Panel A.1 uses the timing of when espionage begins (an agent first begins extracting proprietary information) and Panel A.2 uses the timing of when espionage is first publicly announced. In Panel B, events are unsuccessful cases of economic espionage, where the desired information was not successfully given to its intended recipient. Cumulative abnormal stock market returns are computed using Fama-French factors in the period 30 days before espionage begins. Standard errors are robust.
Panel A: Leader is largest firm Panel B: Leader is top 3
firm
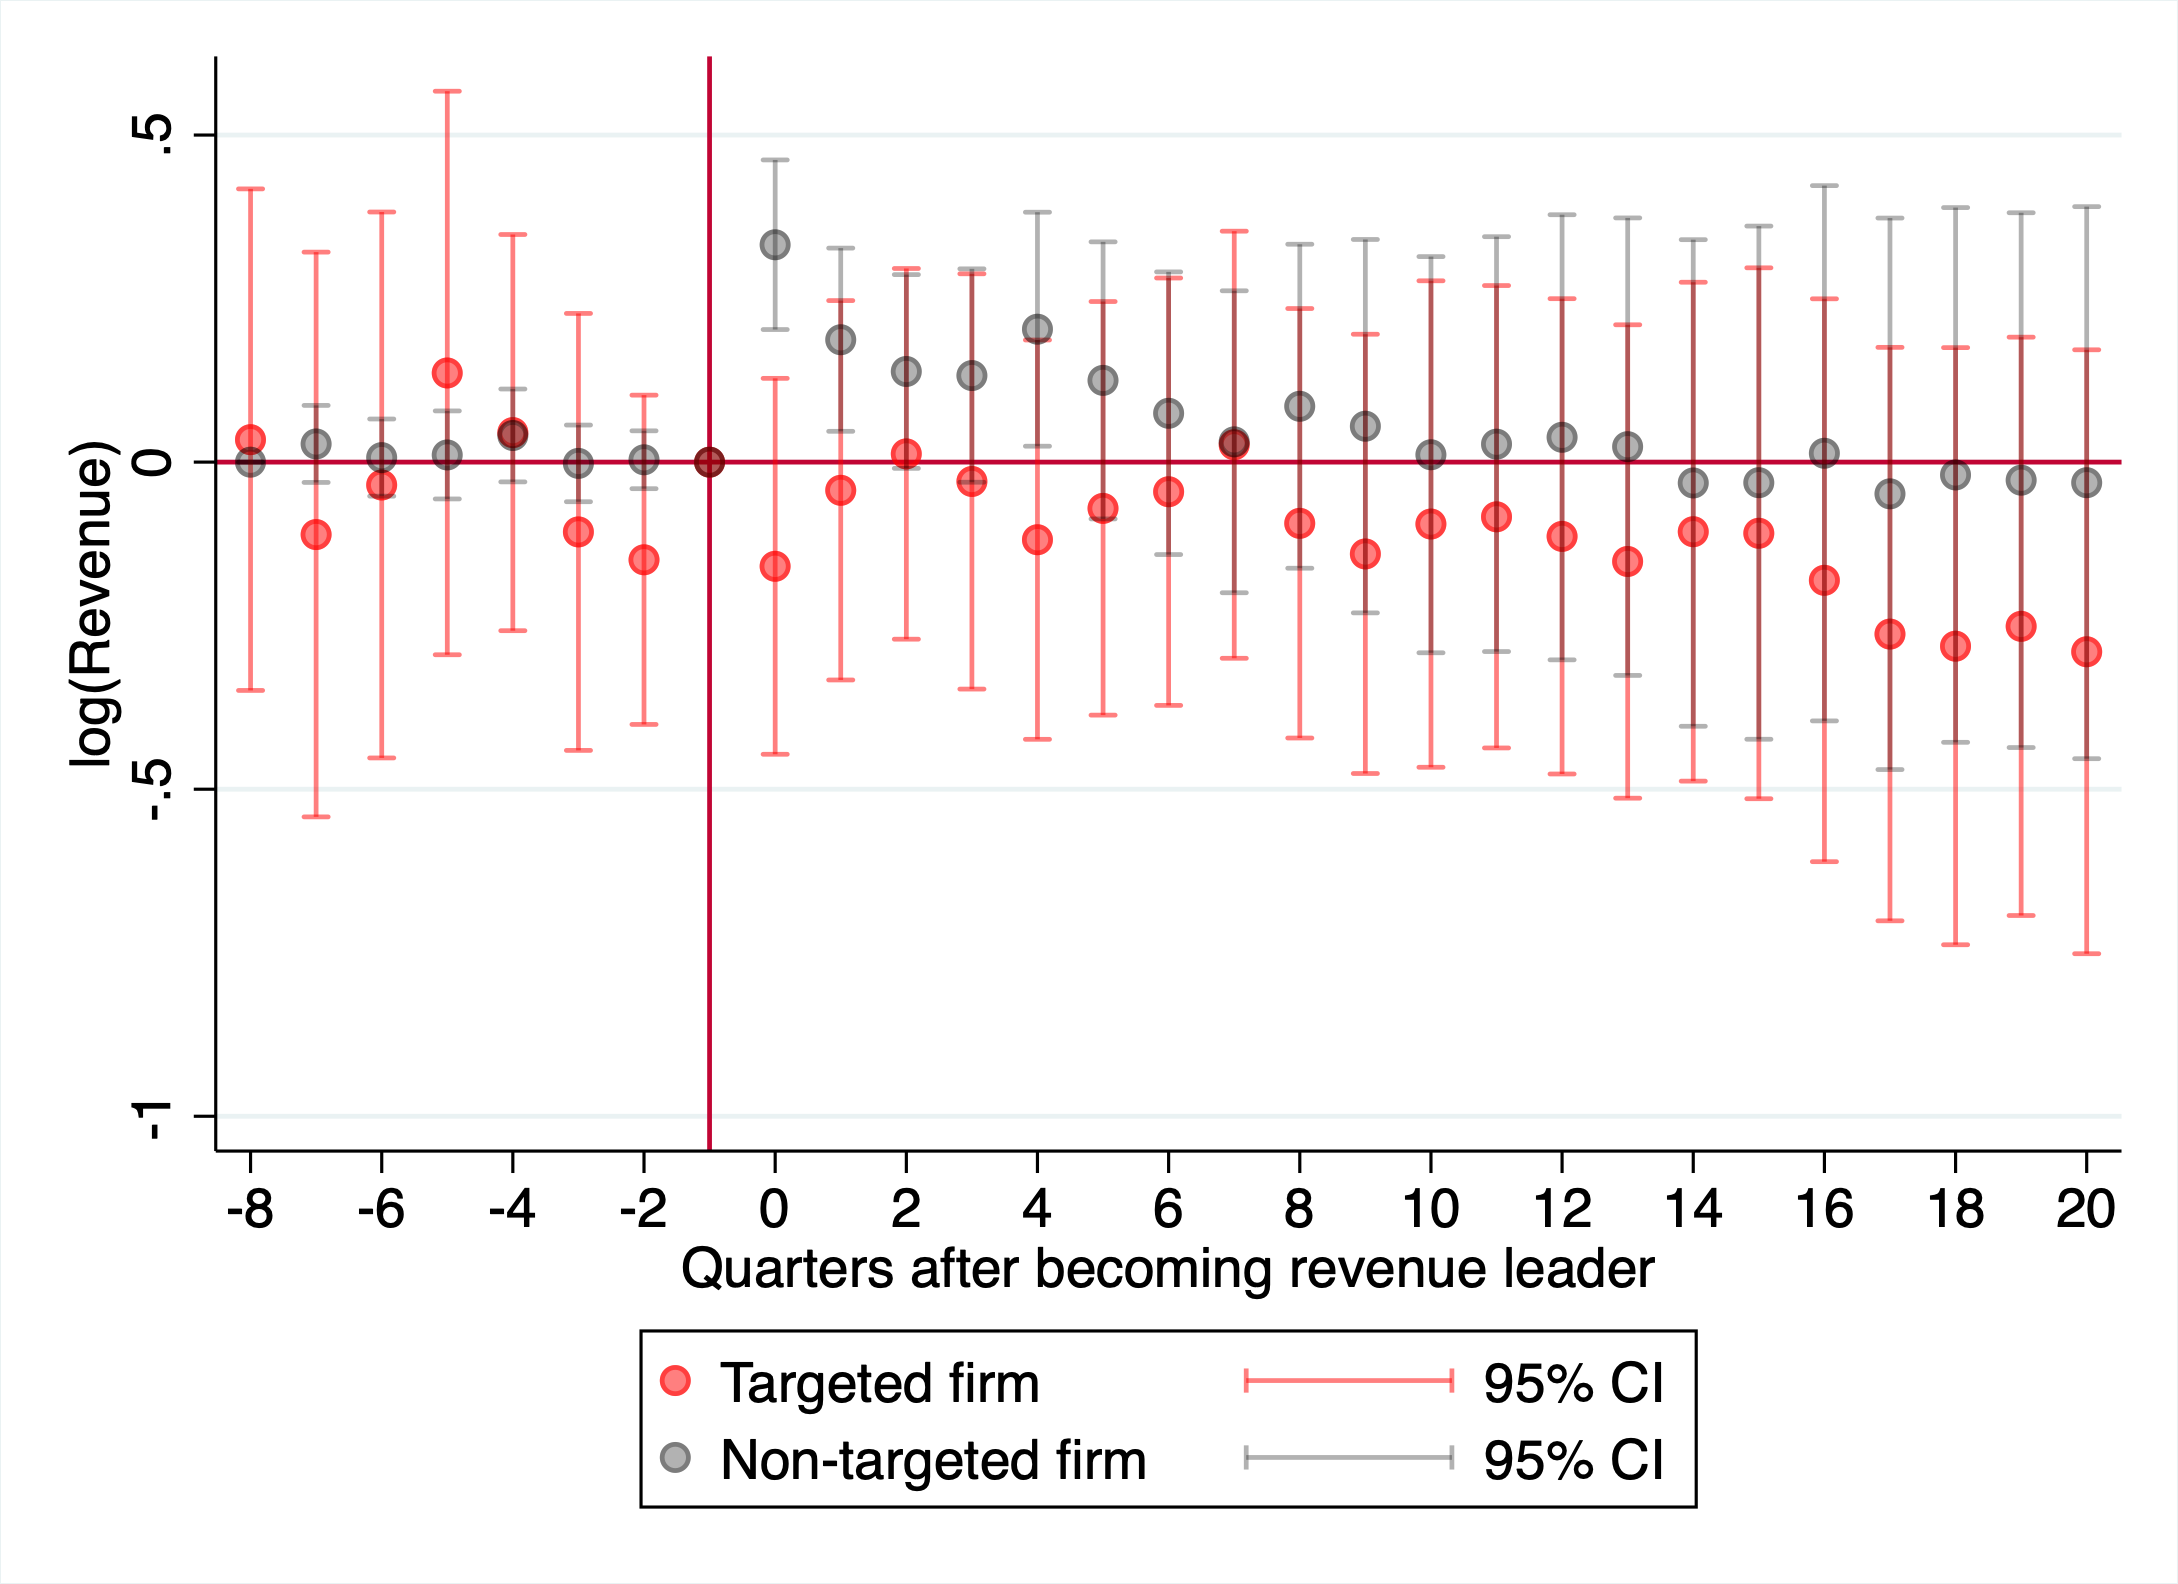
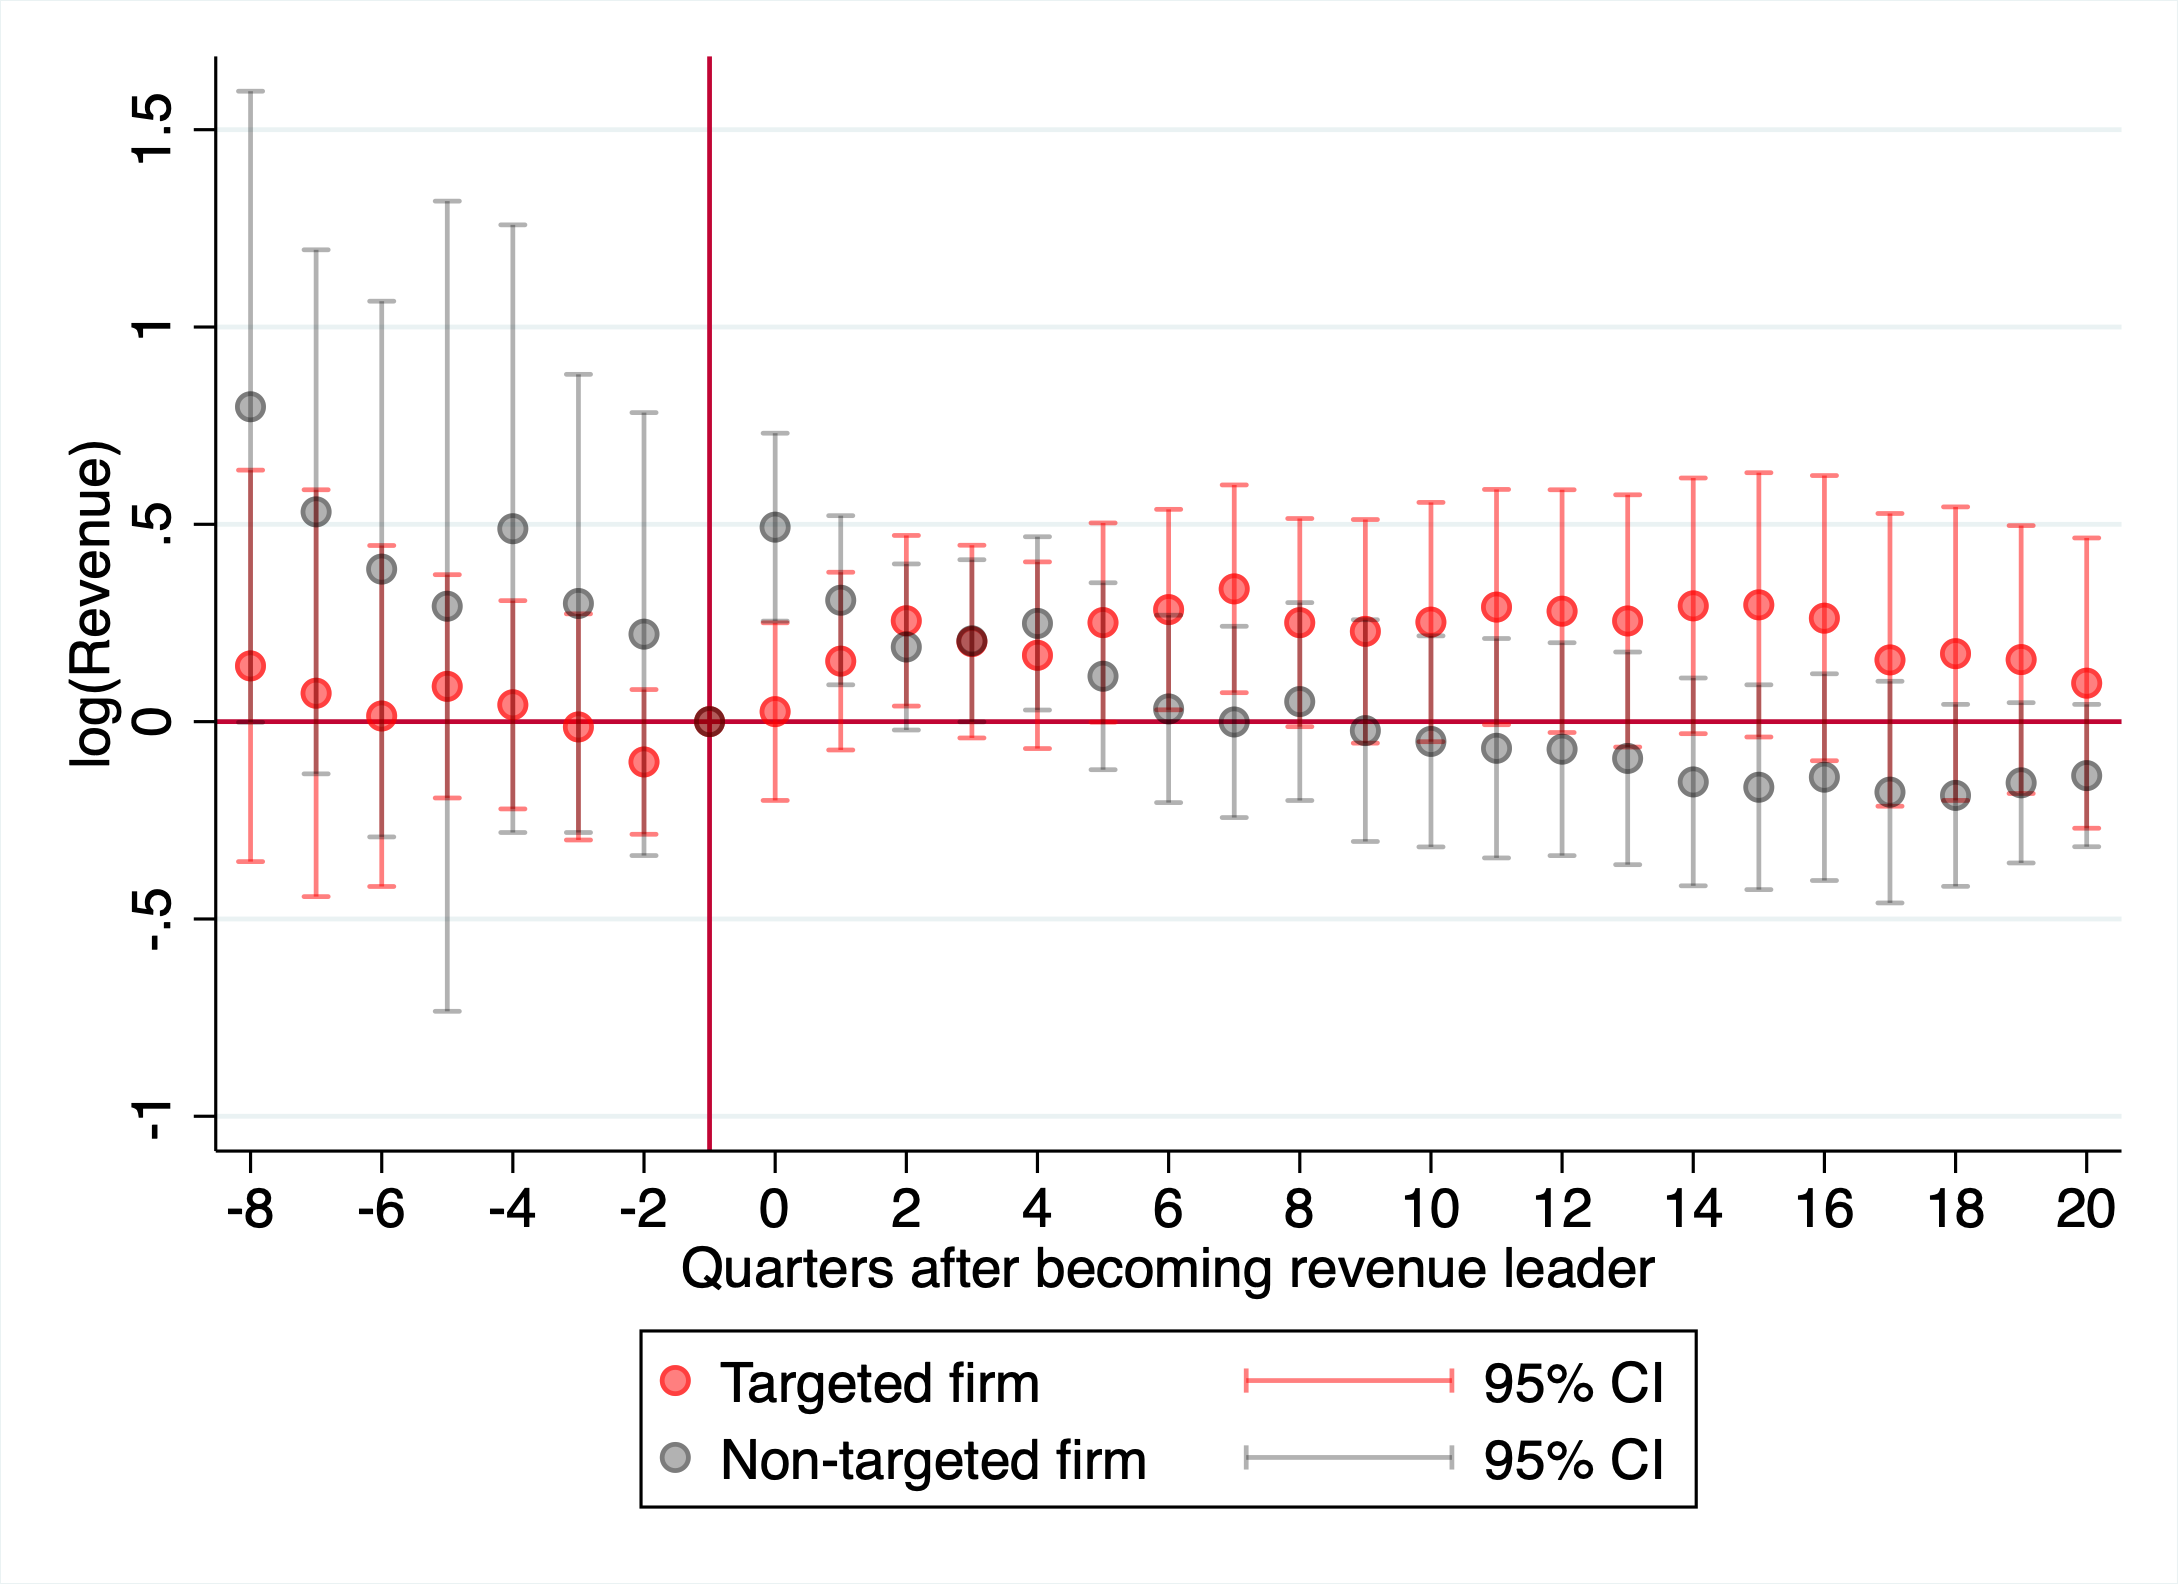
Note: This figure plots coefficients and 95% confidence intervals from two-way fixed effects event study regressions. An event is a firm becoming a leader in their industry (SIC-4). In Panel A, a leader is defined as the largest firm by revenue. In Panel B, a leader is defined as a top three firm by revenue. The outcome is log(Revenue). Estimates for firms ever targeted for economic espionage are plotted in red, and for non-targeted firms (in targeted industries) in black. Standard errors are clustered at the firm level.
Panel A: baseline Panel B: all majors
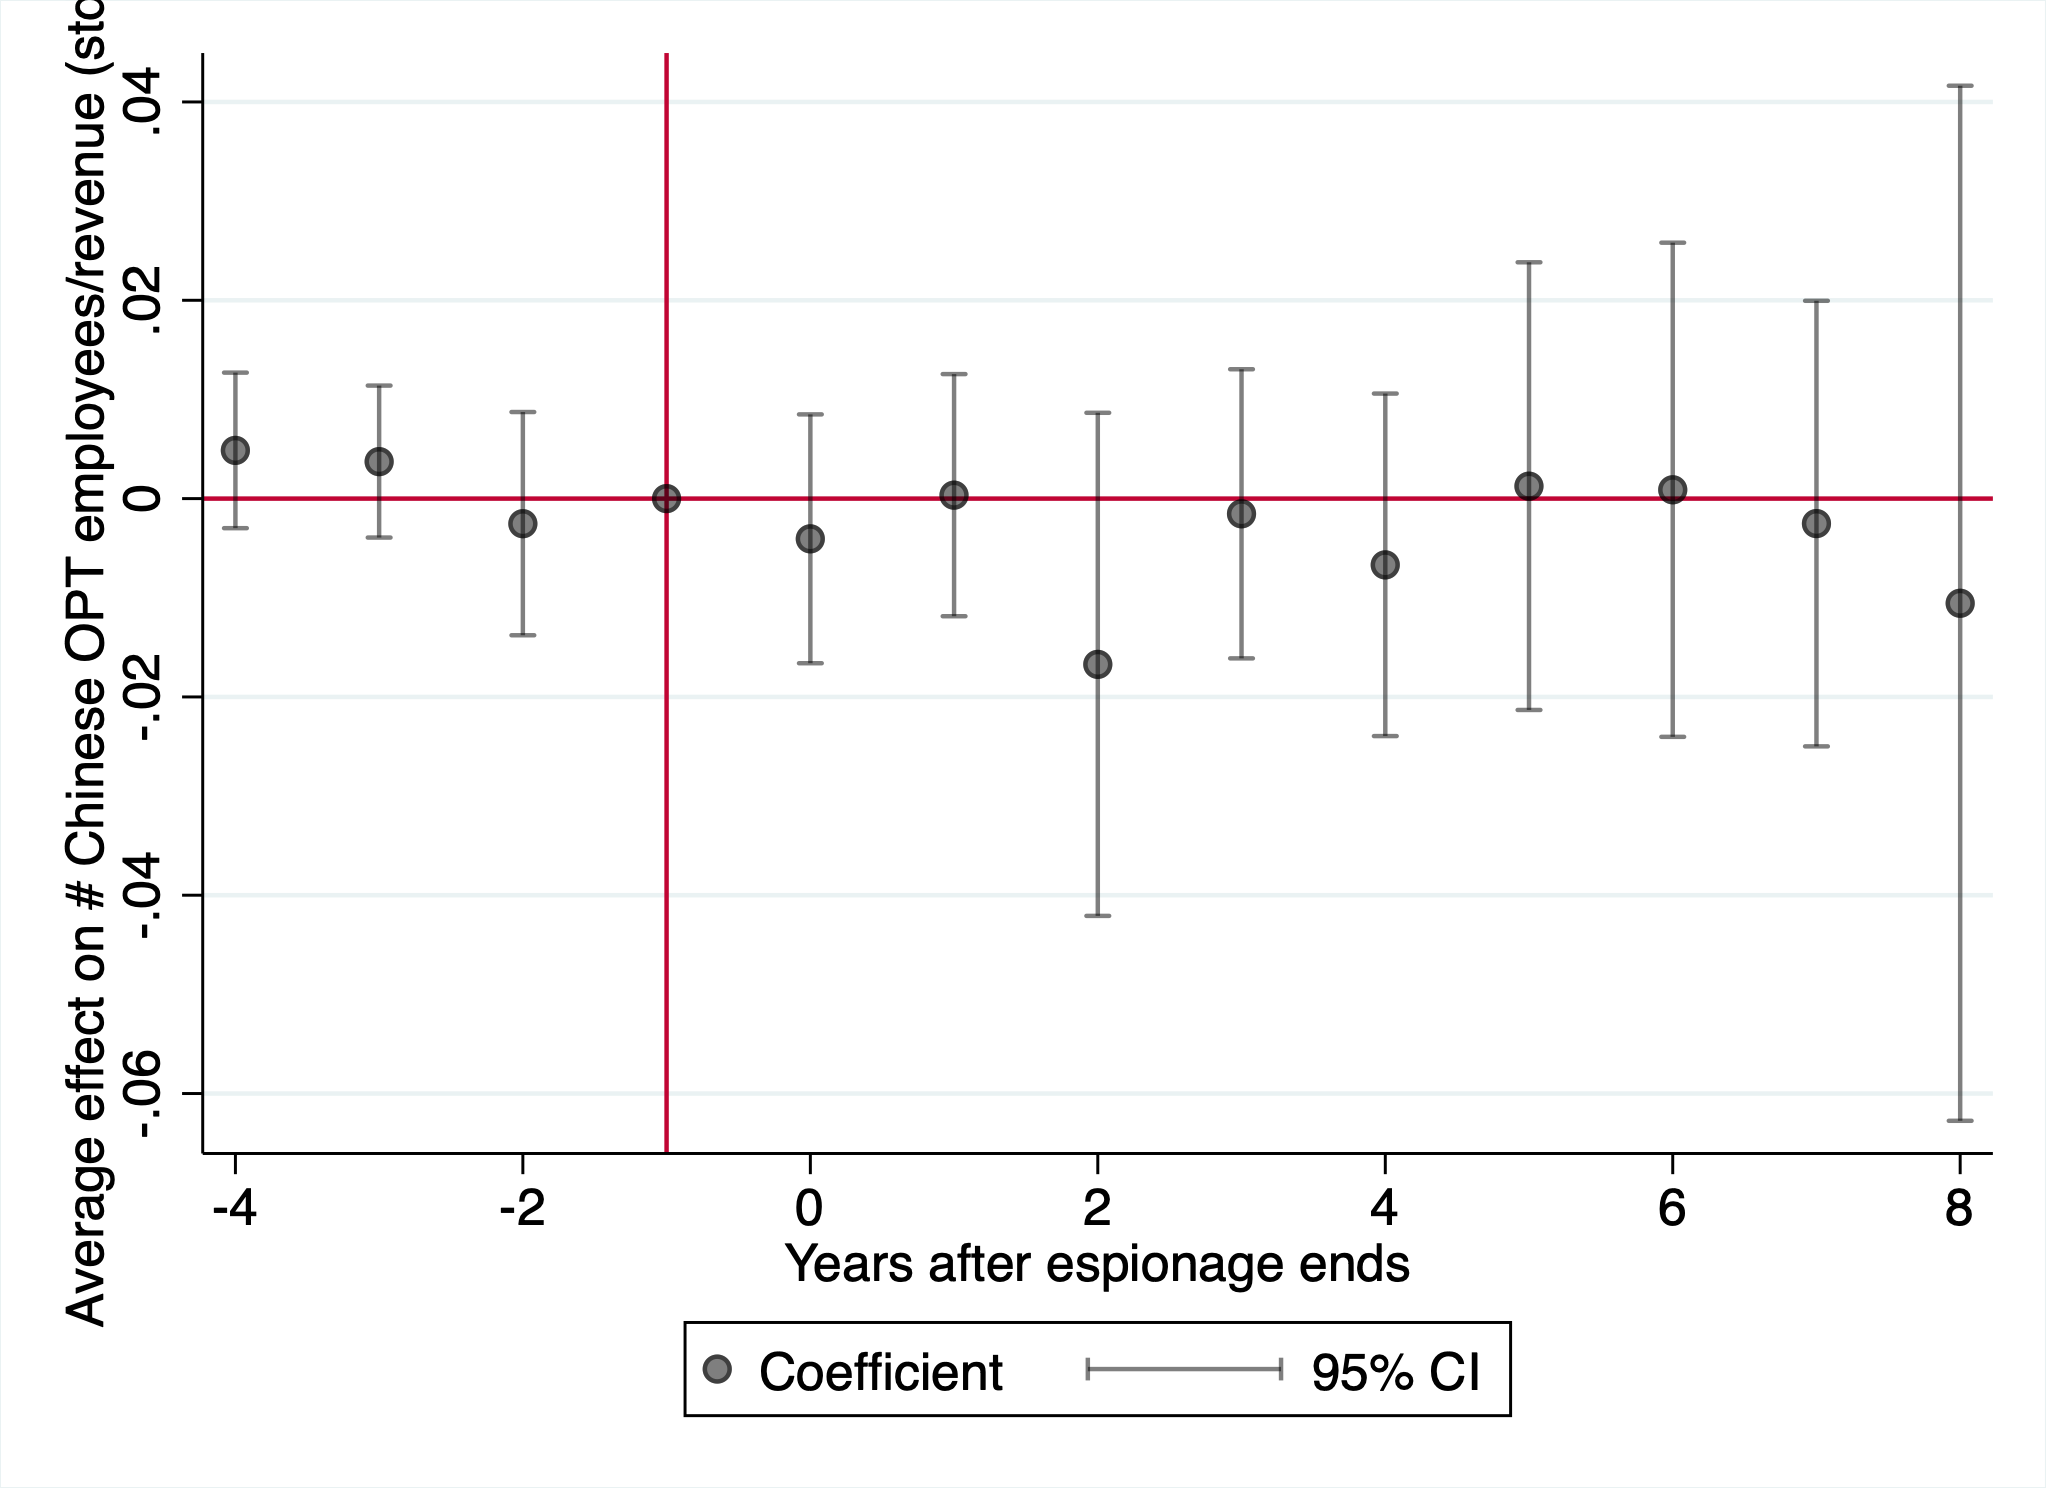
Panel C: all degrees Panel D: mainland China only
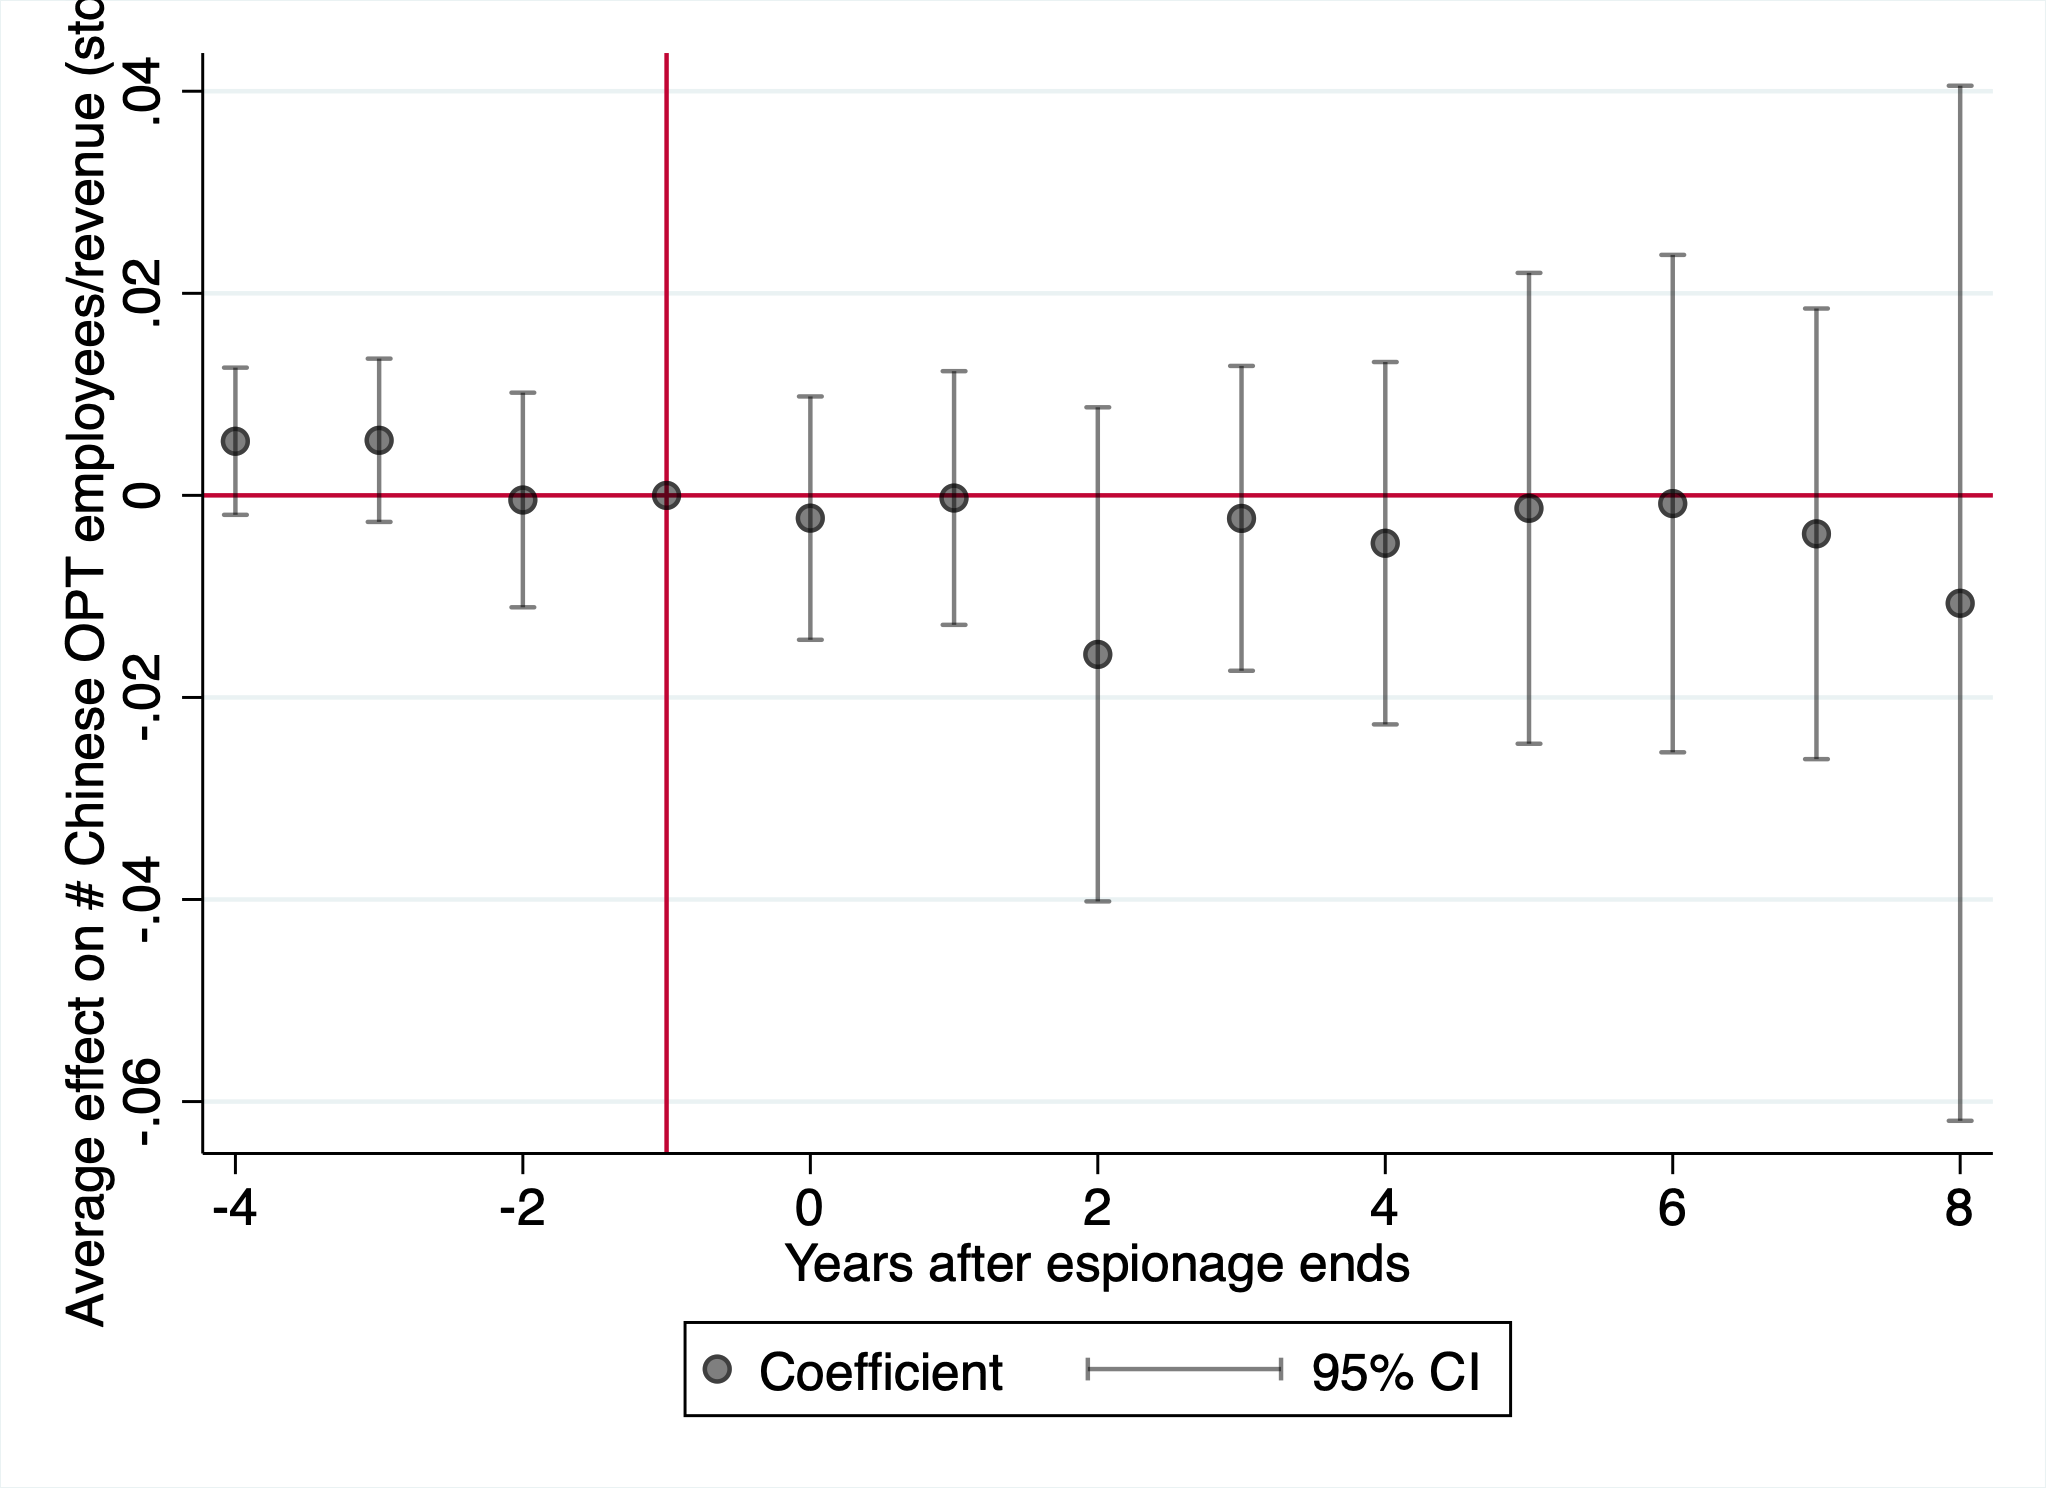
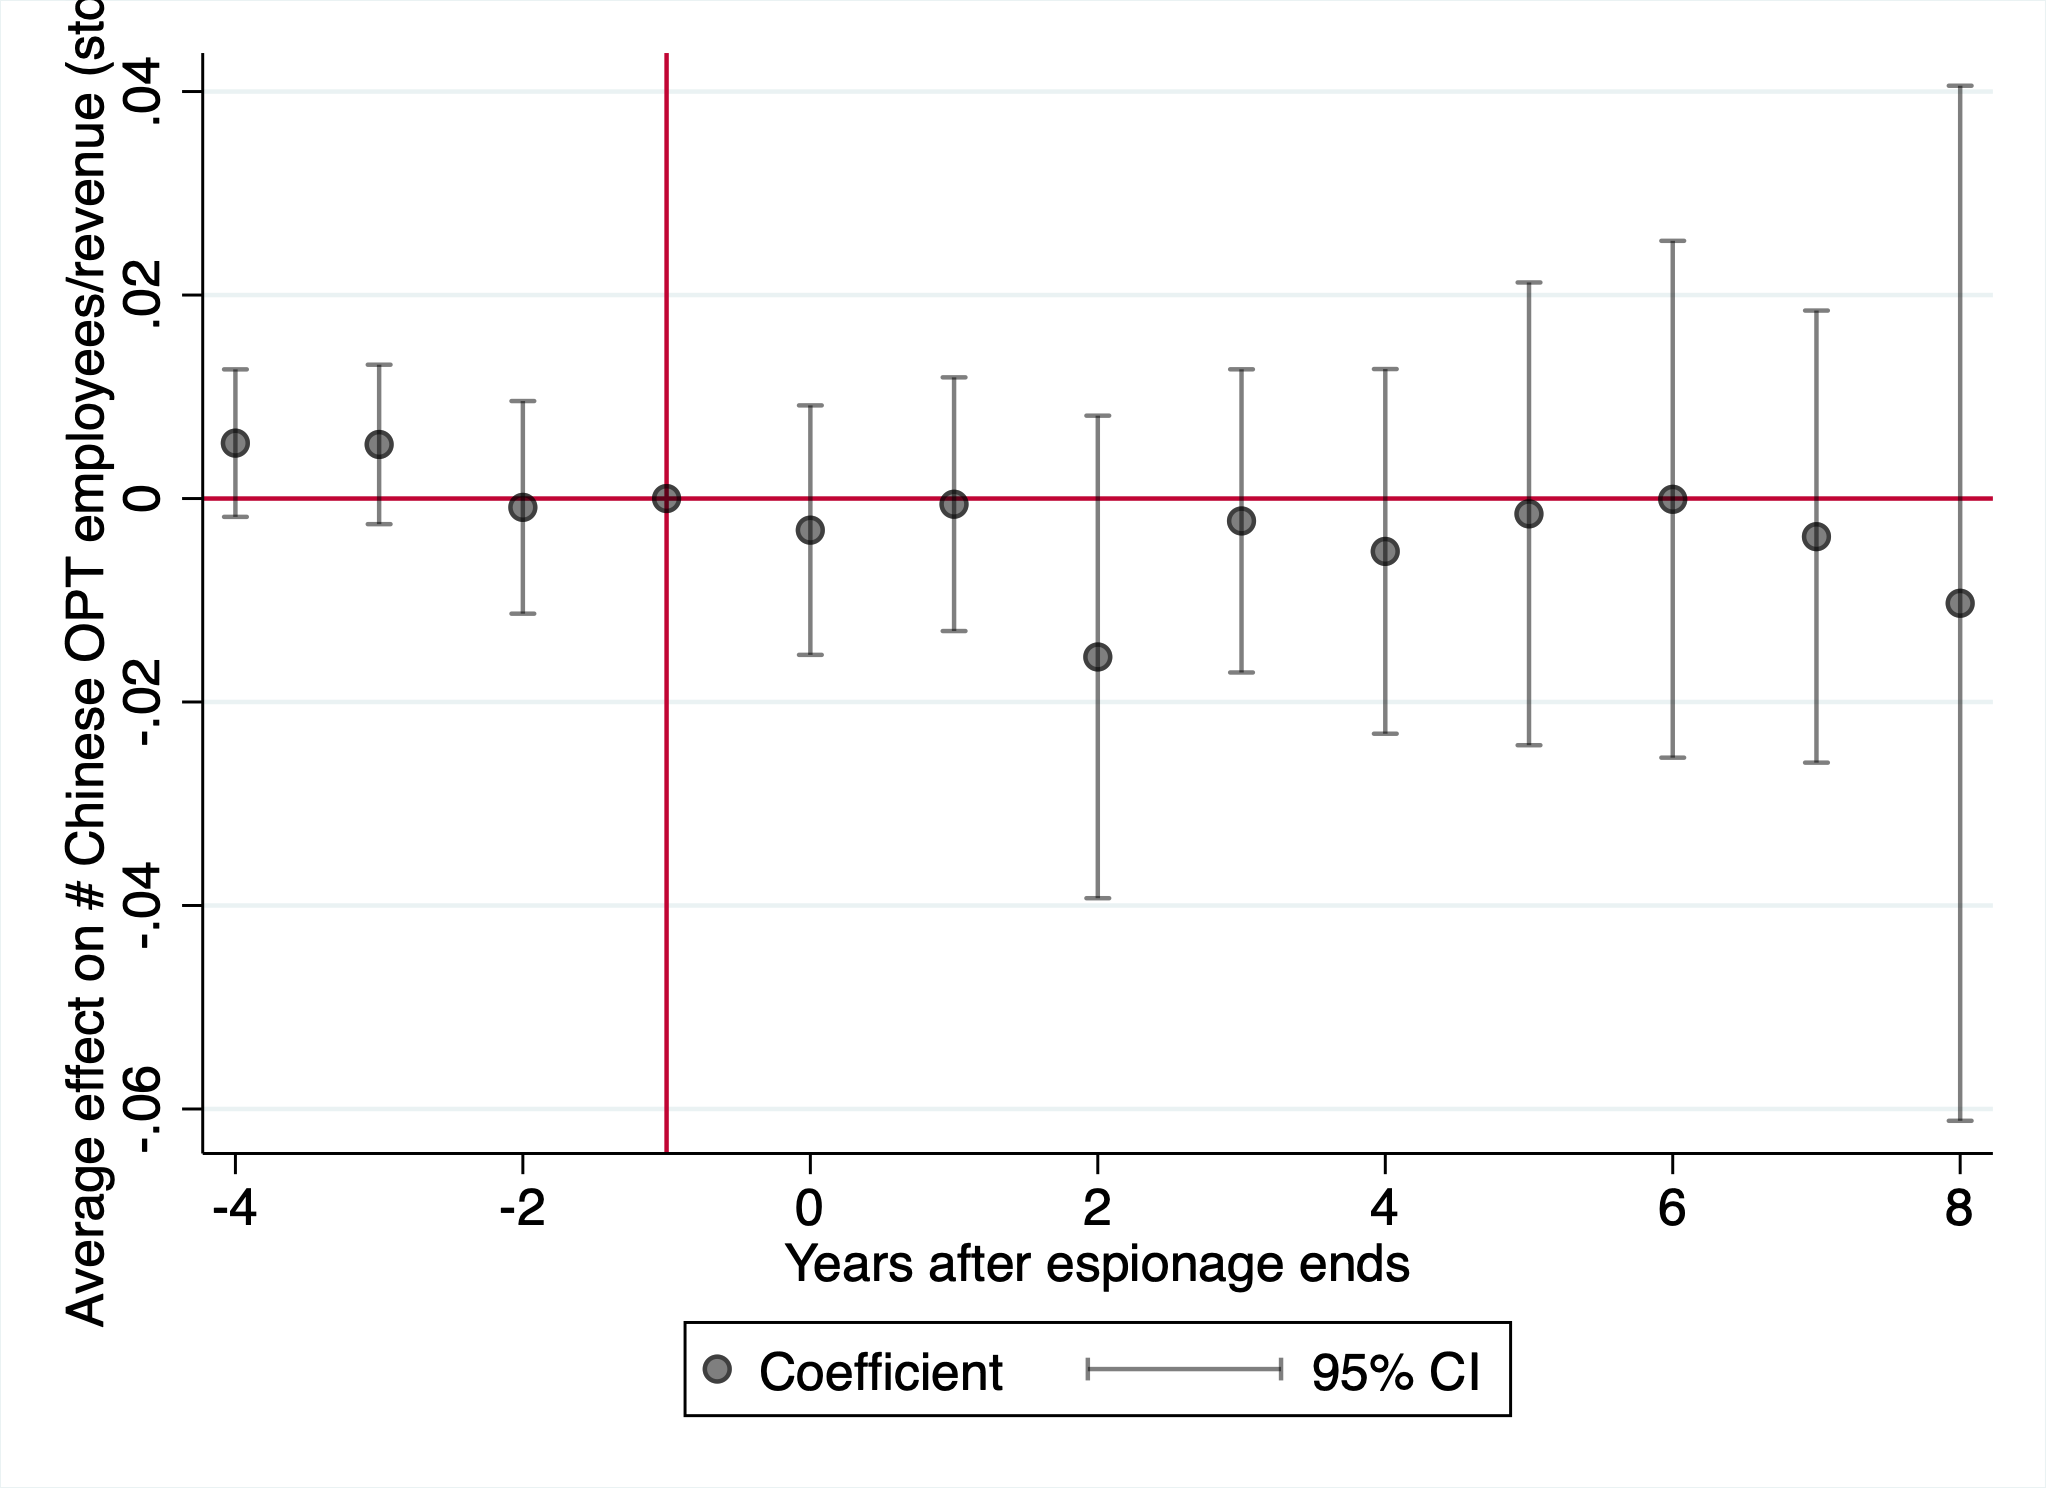
Note: This figure plots coefficients and 95% confidence intervals from two-way fixed effects regressions. An event is when an successful economic espionage incident ends. The outcome in Panel A is the (standardized) number of Chinese advanced-degree STEM OPT employees per million dollars of revenue. In Panel B, we include workers from all majors (including non-STEM). In Panel C, we include all degrees (e.g., including bachelors). In Panel D, we restrict the definition of China to only mainland China (removing Hong Kong). Standard errors are clustered at the firm level.
Panel A: Patents per $M R&D Panel B: Patent
inventor in China
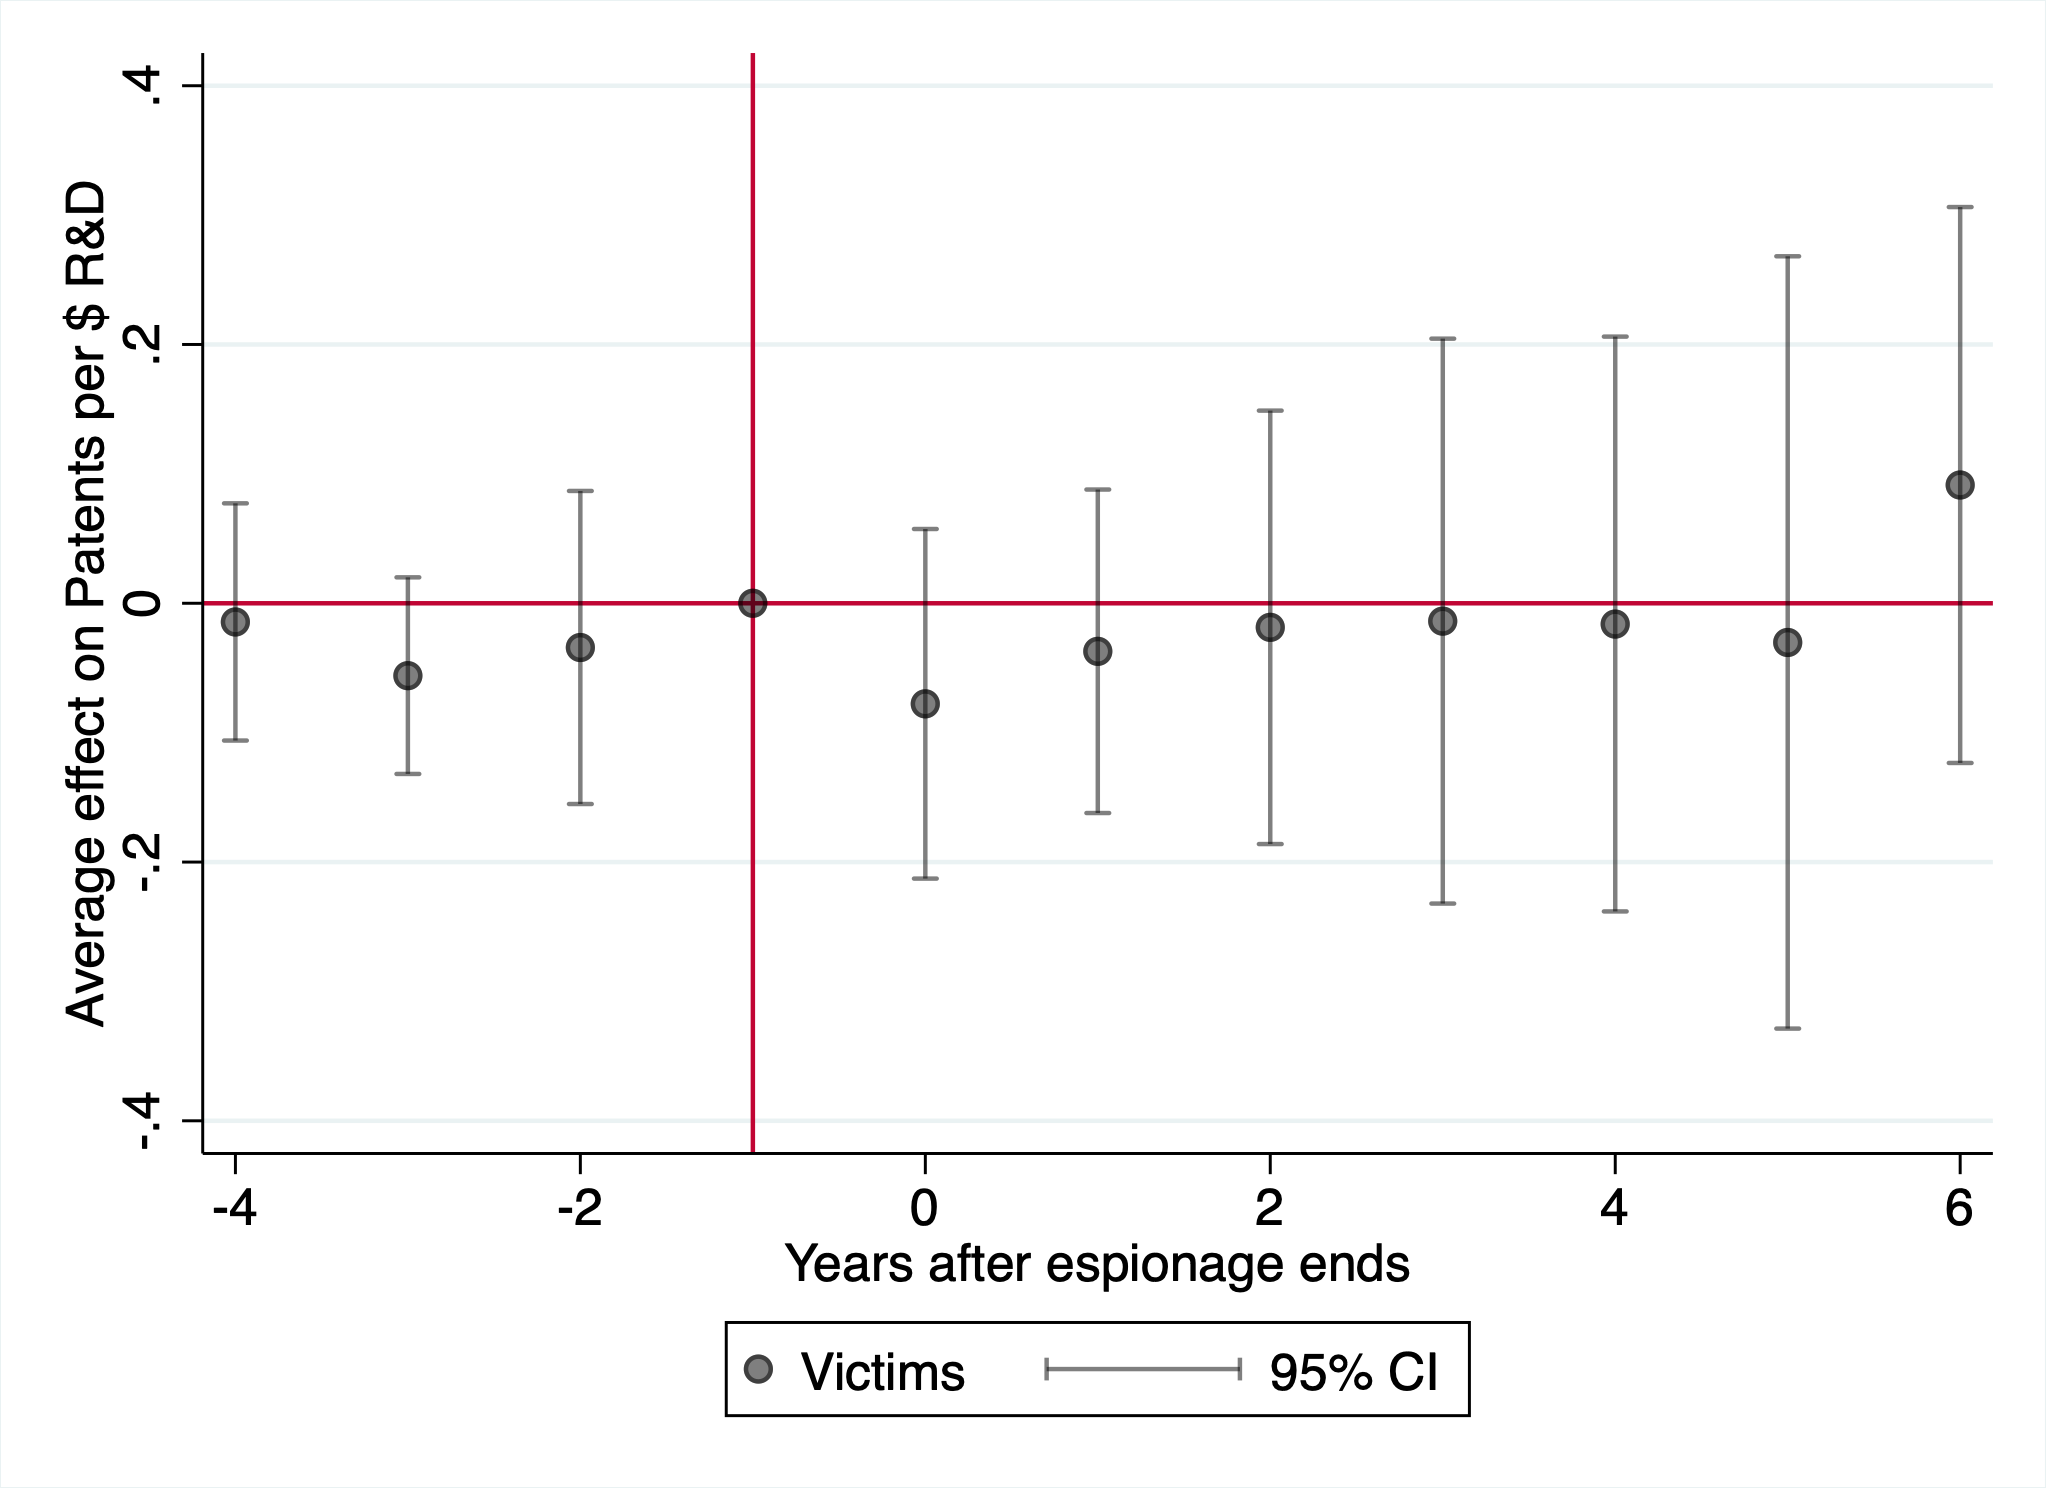
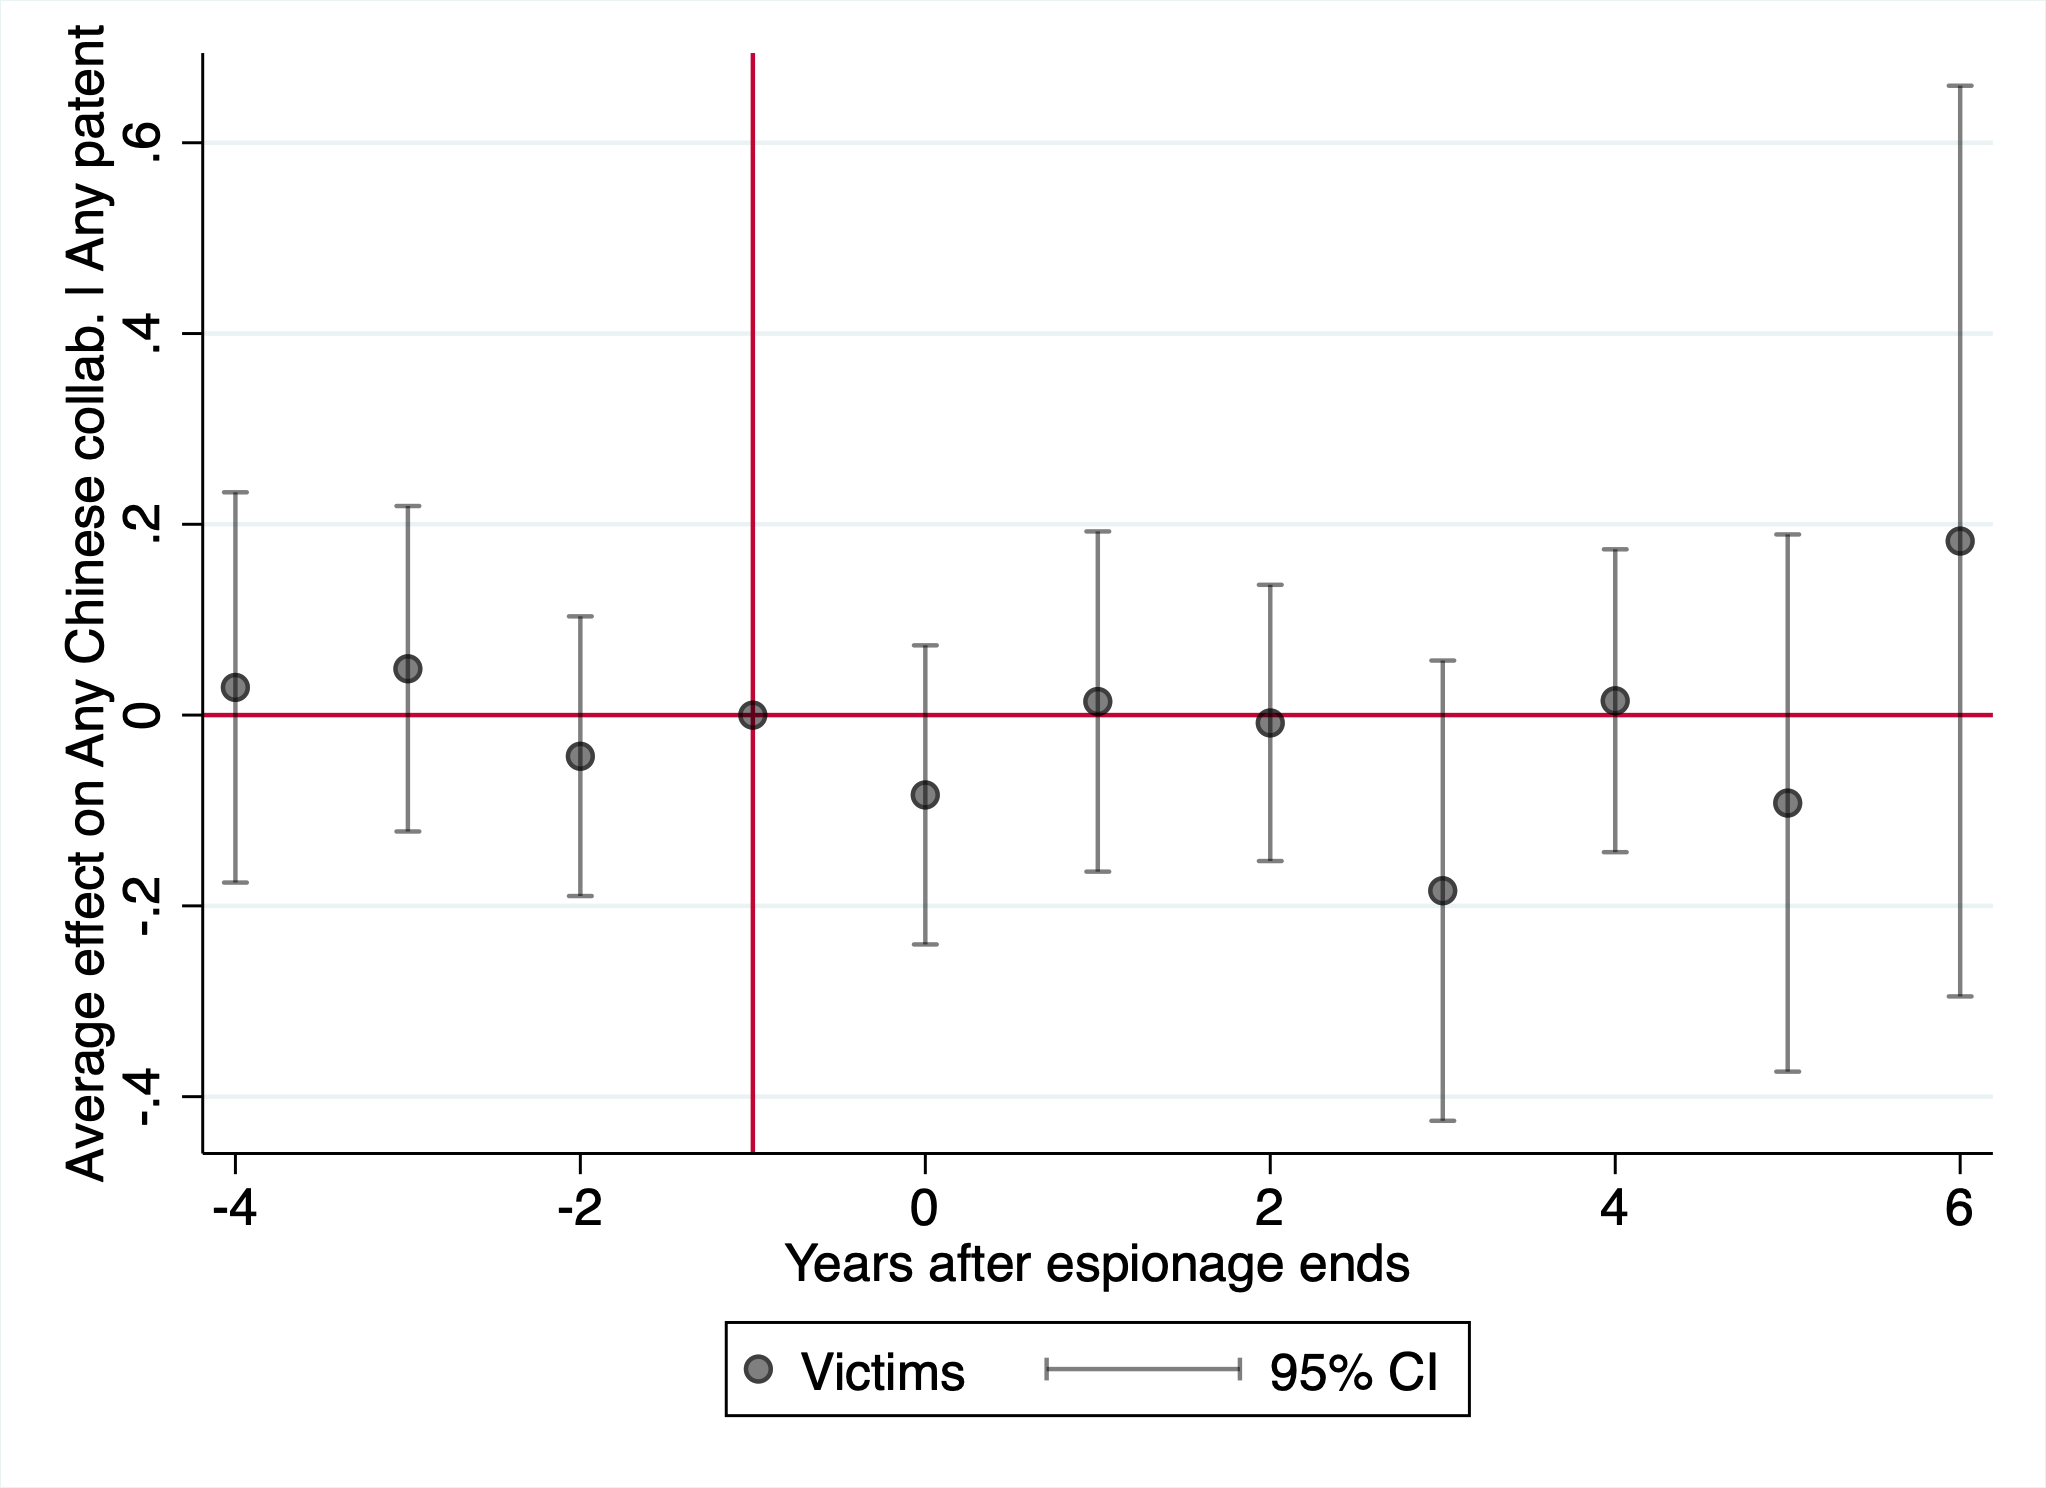
Panel C: China citation share of patents Panel D: Chinese OPTs per
$M revenue
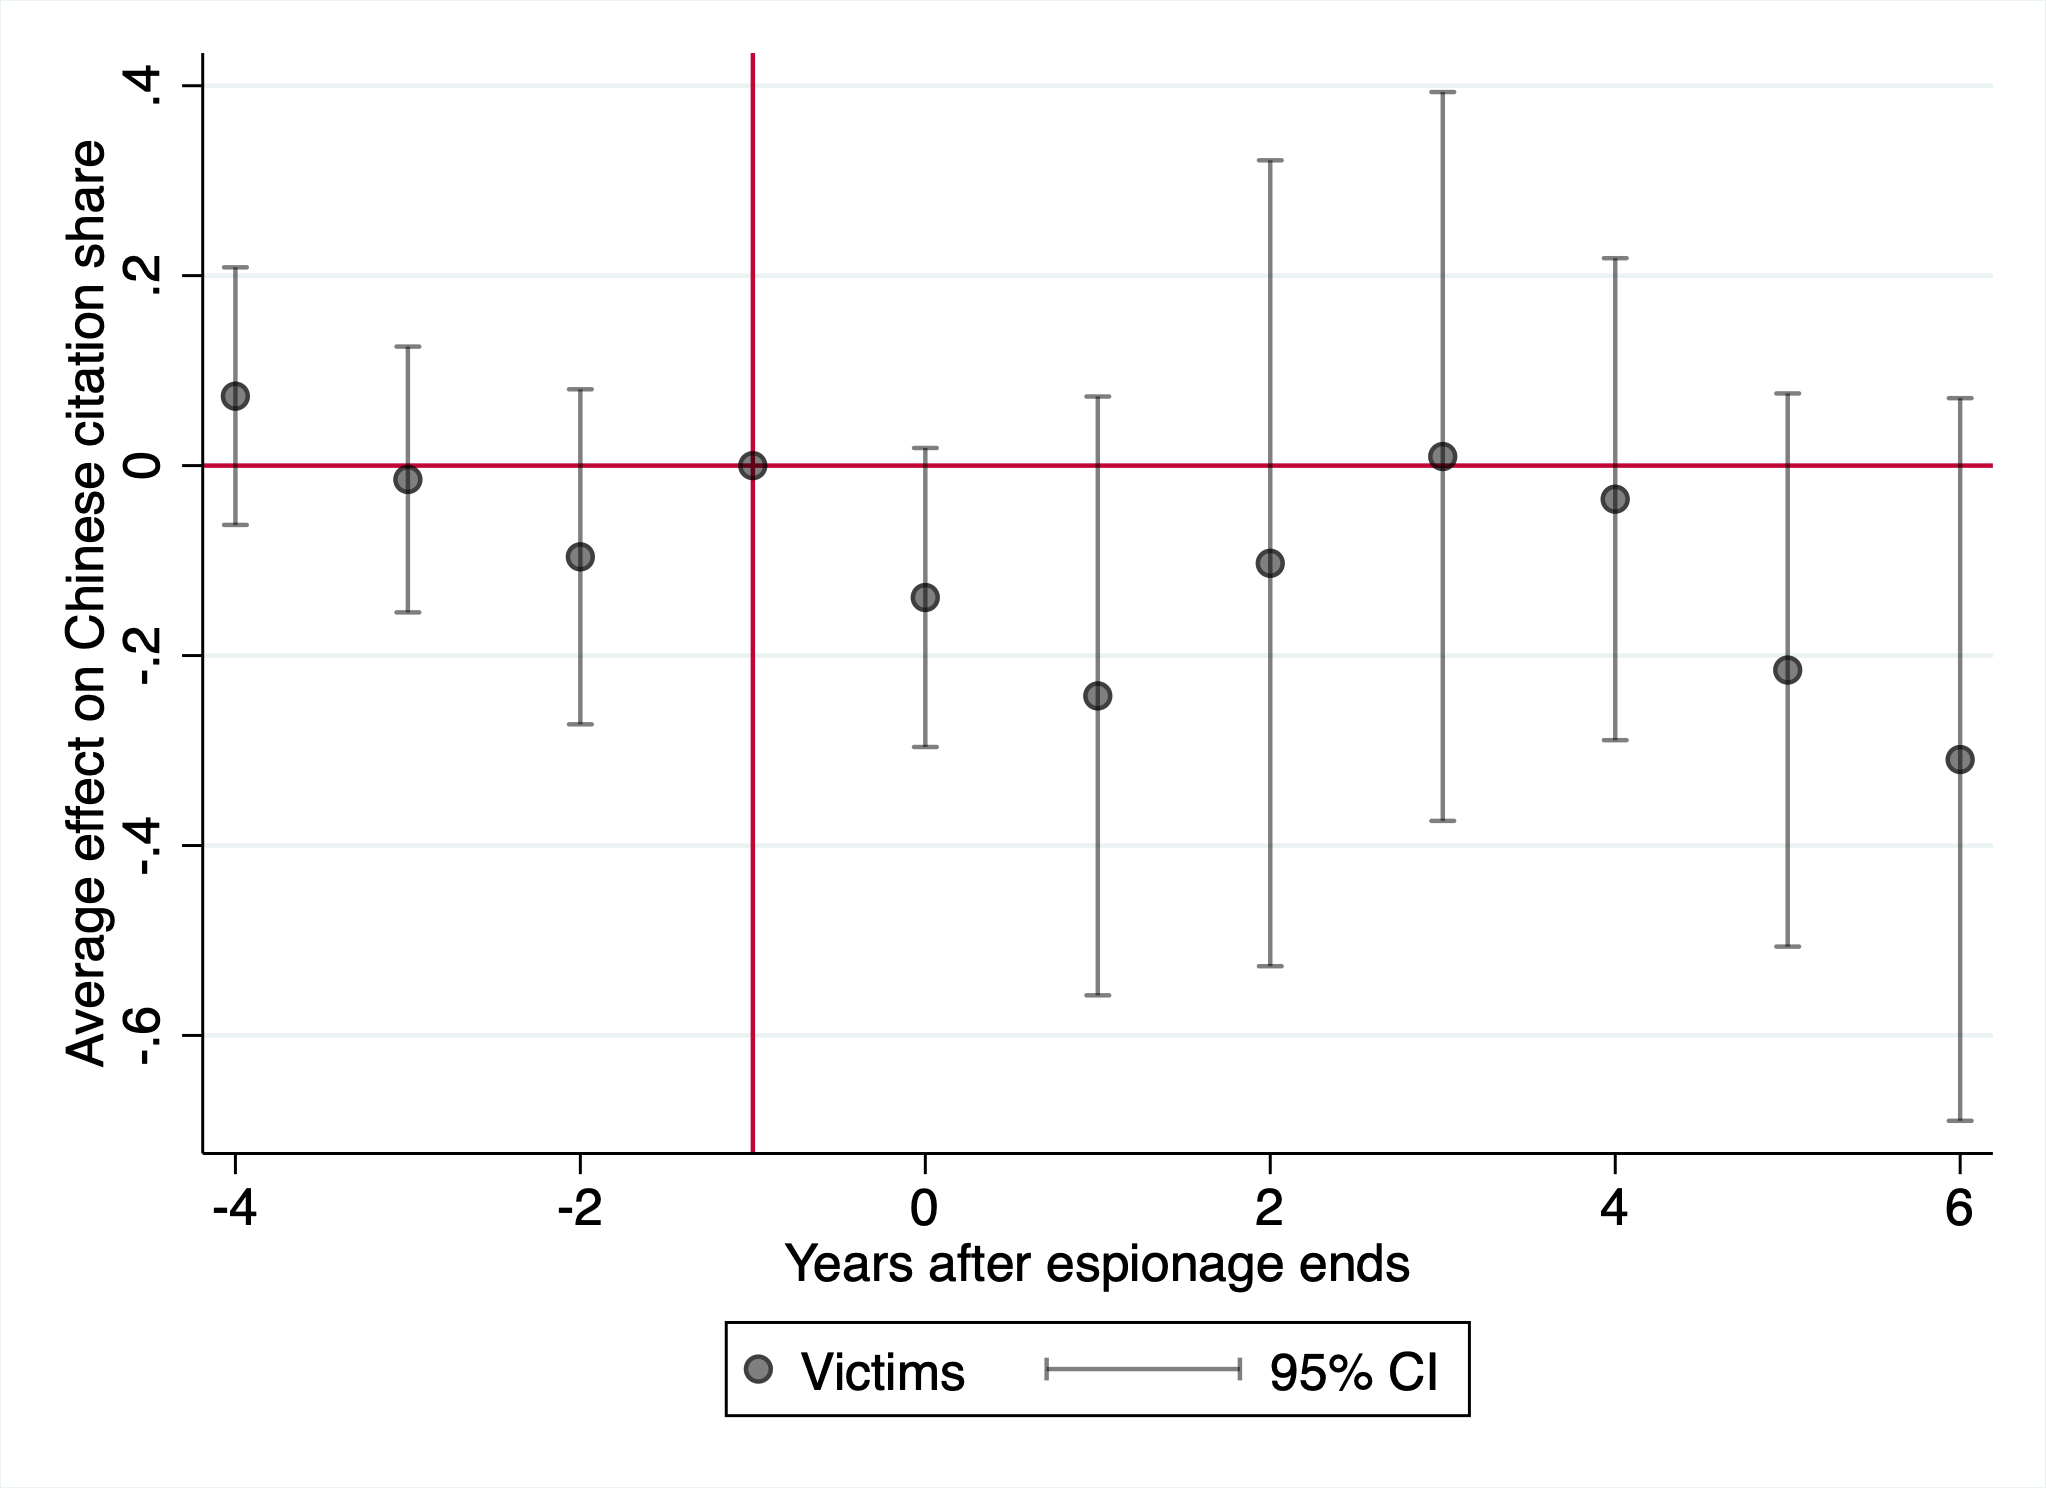
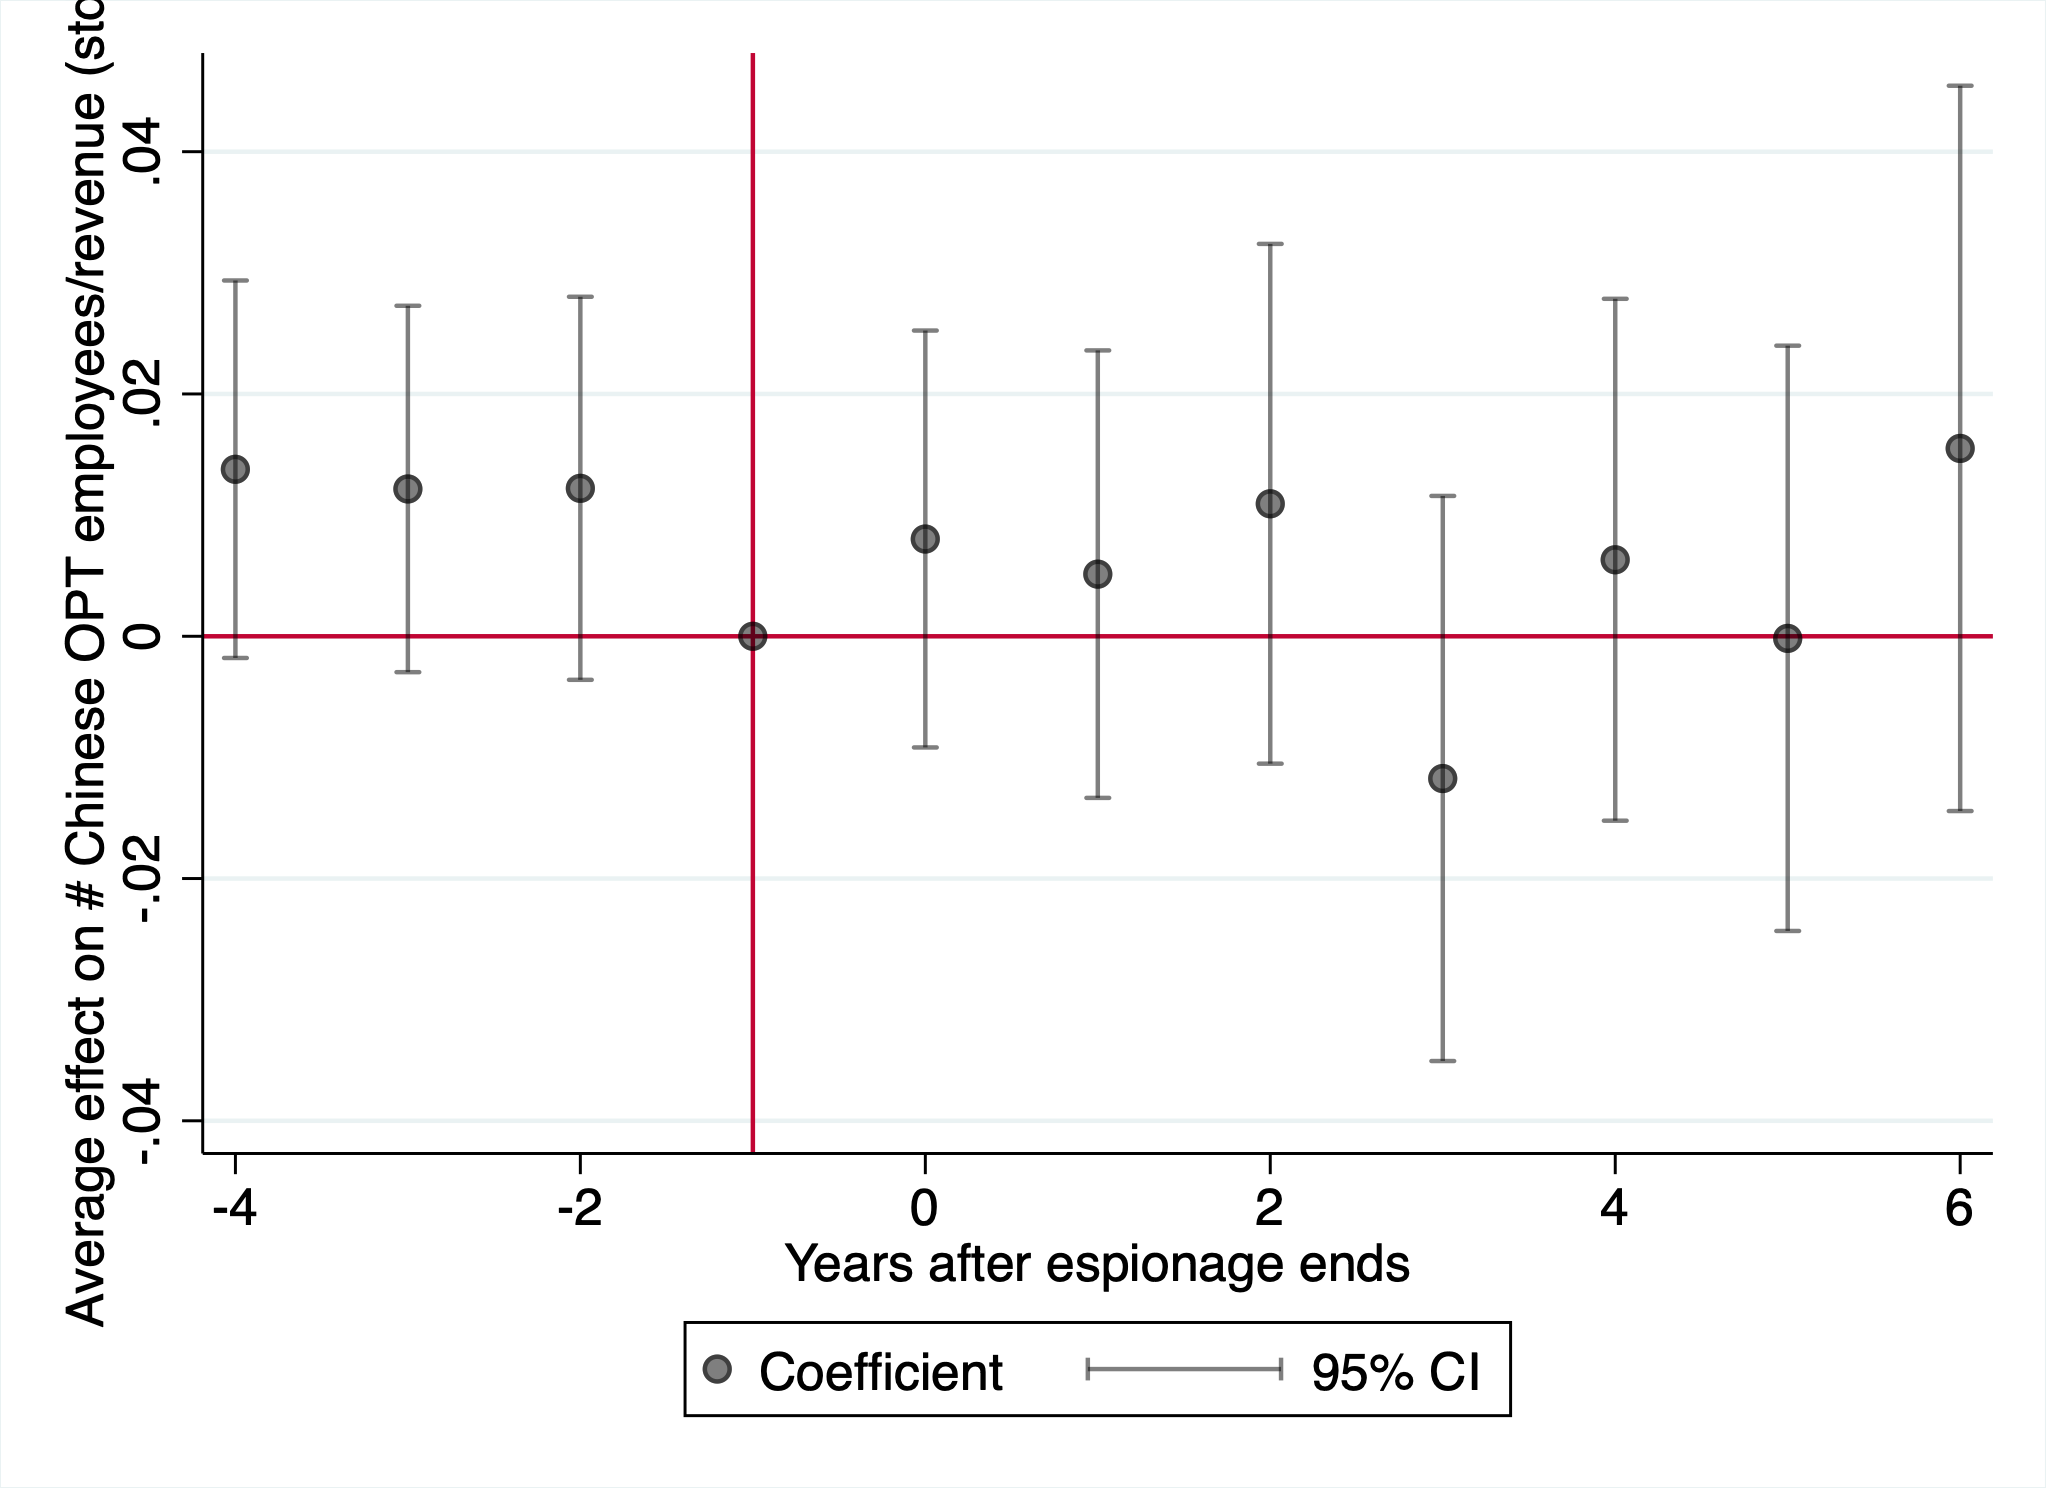
Panel E: log(Geographical markets) Panel F: index
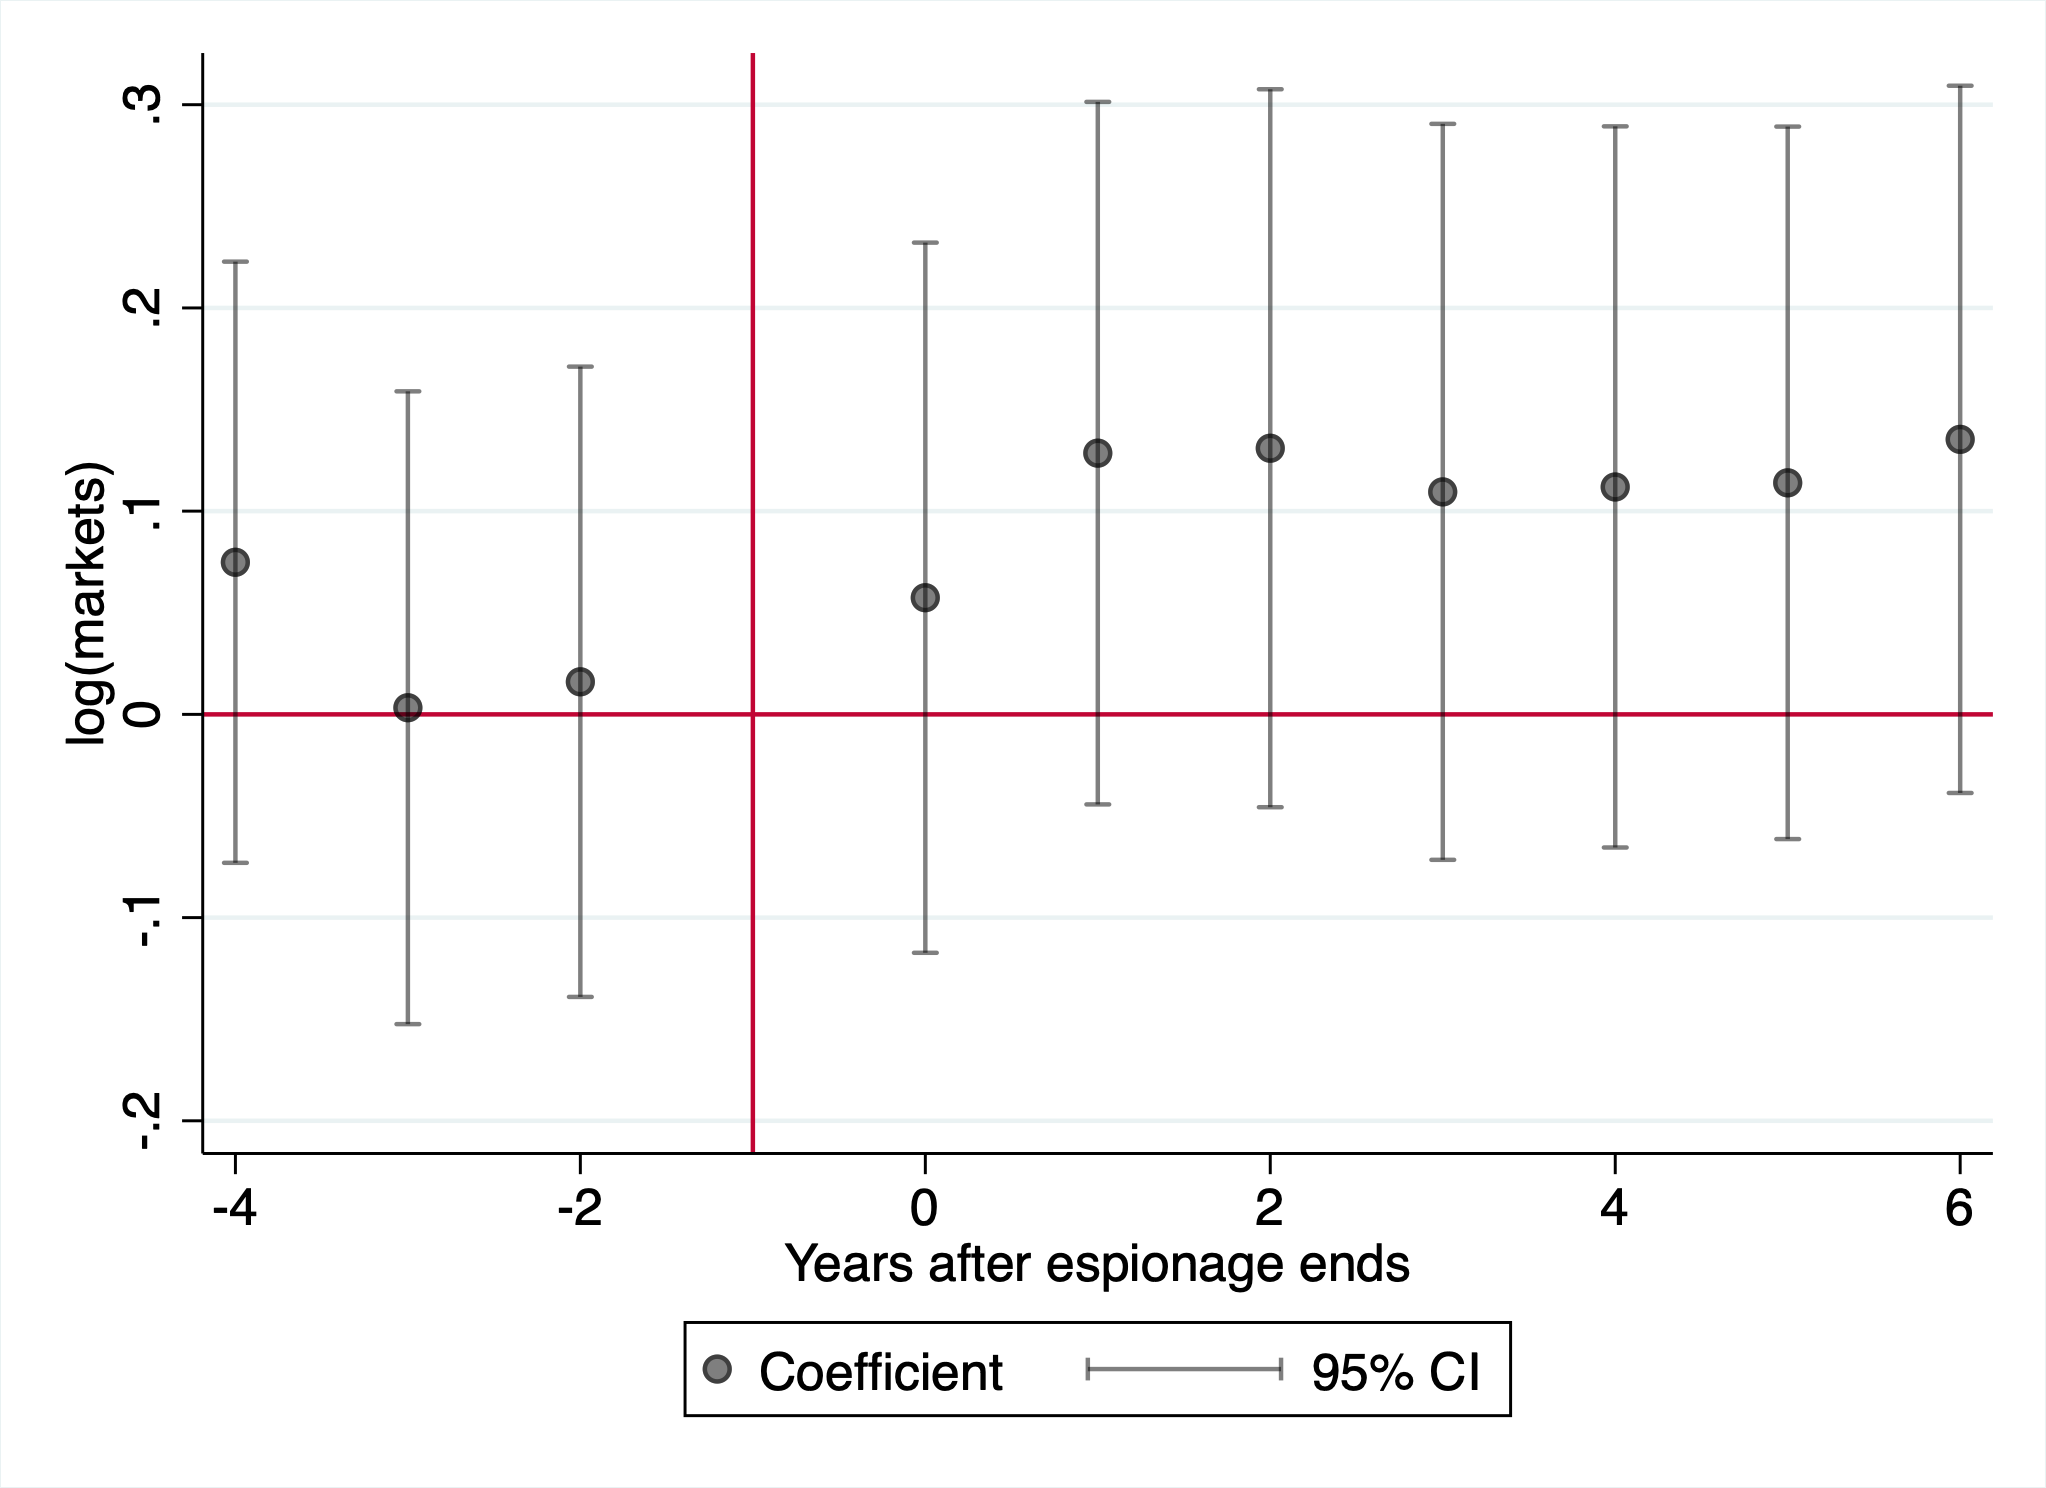
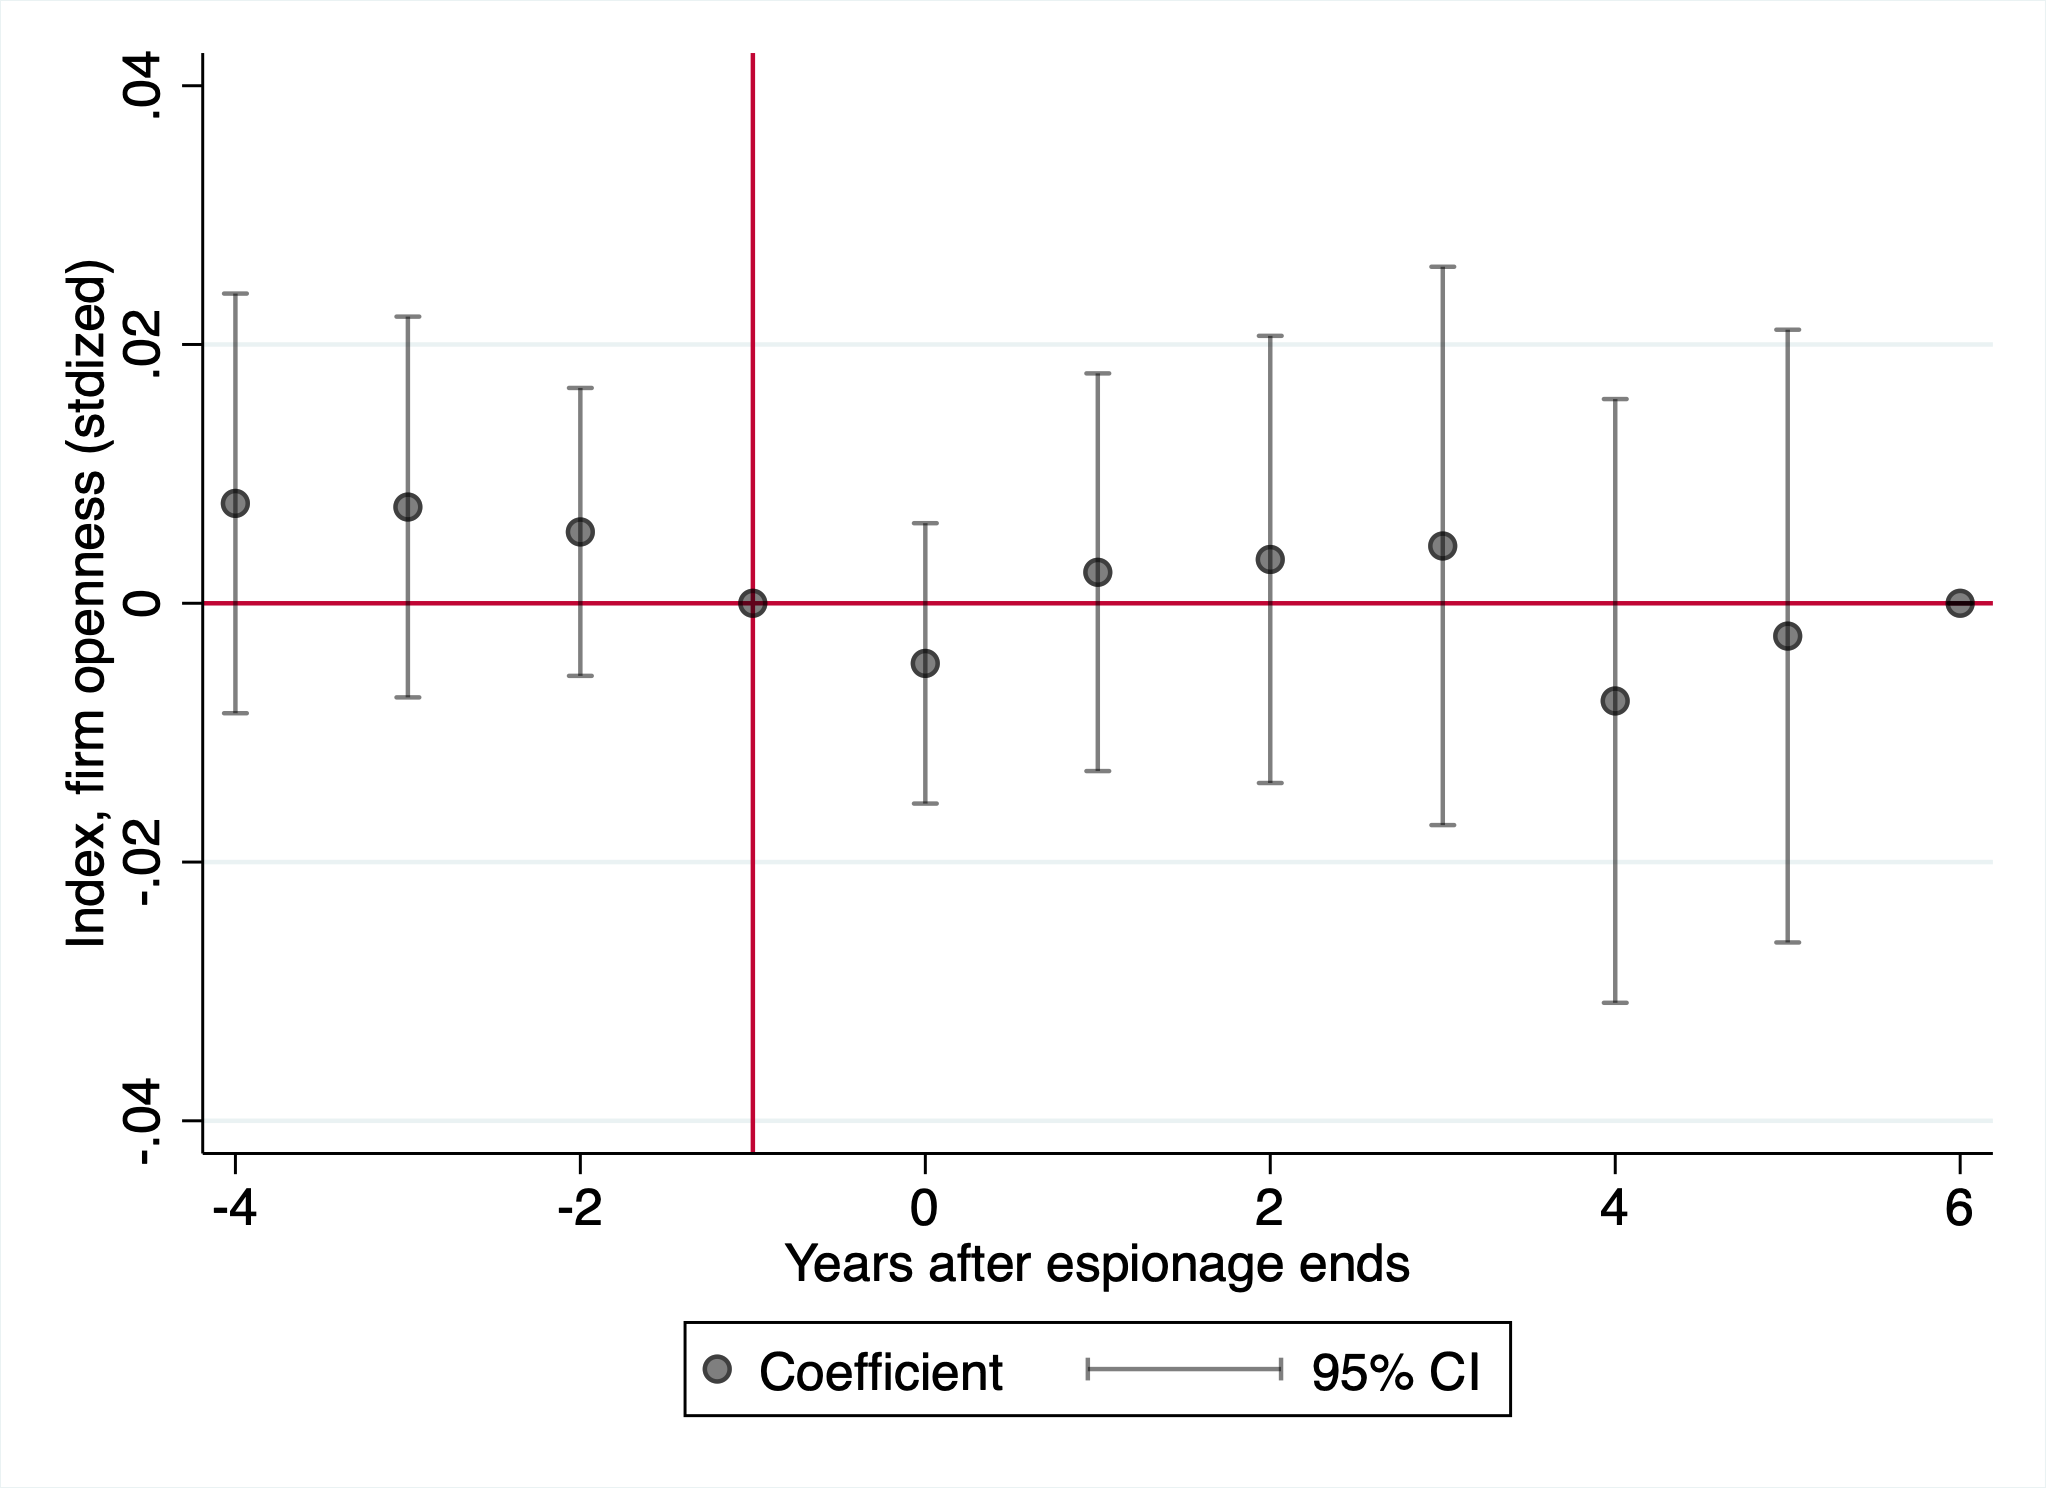
Note: This figure plots coefficients and 95% confidence intervals from two-way fixed effects regressions. An event is when a firm announces a successful economic espionage incident. The outcome in Panel A is patents per million dollars in R&D, Panel B China’s citation share of patents by the firm, Panel C an indicator for collaborating with a Chinese patent inventor (conditional on patenting), Panel D the (standardized) number of Chinese advanced-degree STEM OPT employees per million dollars of revenue, in Panel E the log of the number of geographical markets the company reports being active in, and in Panel F the inverse covariance weighted index of outcomes in Panels A-E. Standard errors are clustered at the firm level.
Panel A: TF-IDF Panel B: fine-tuned BERT
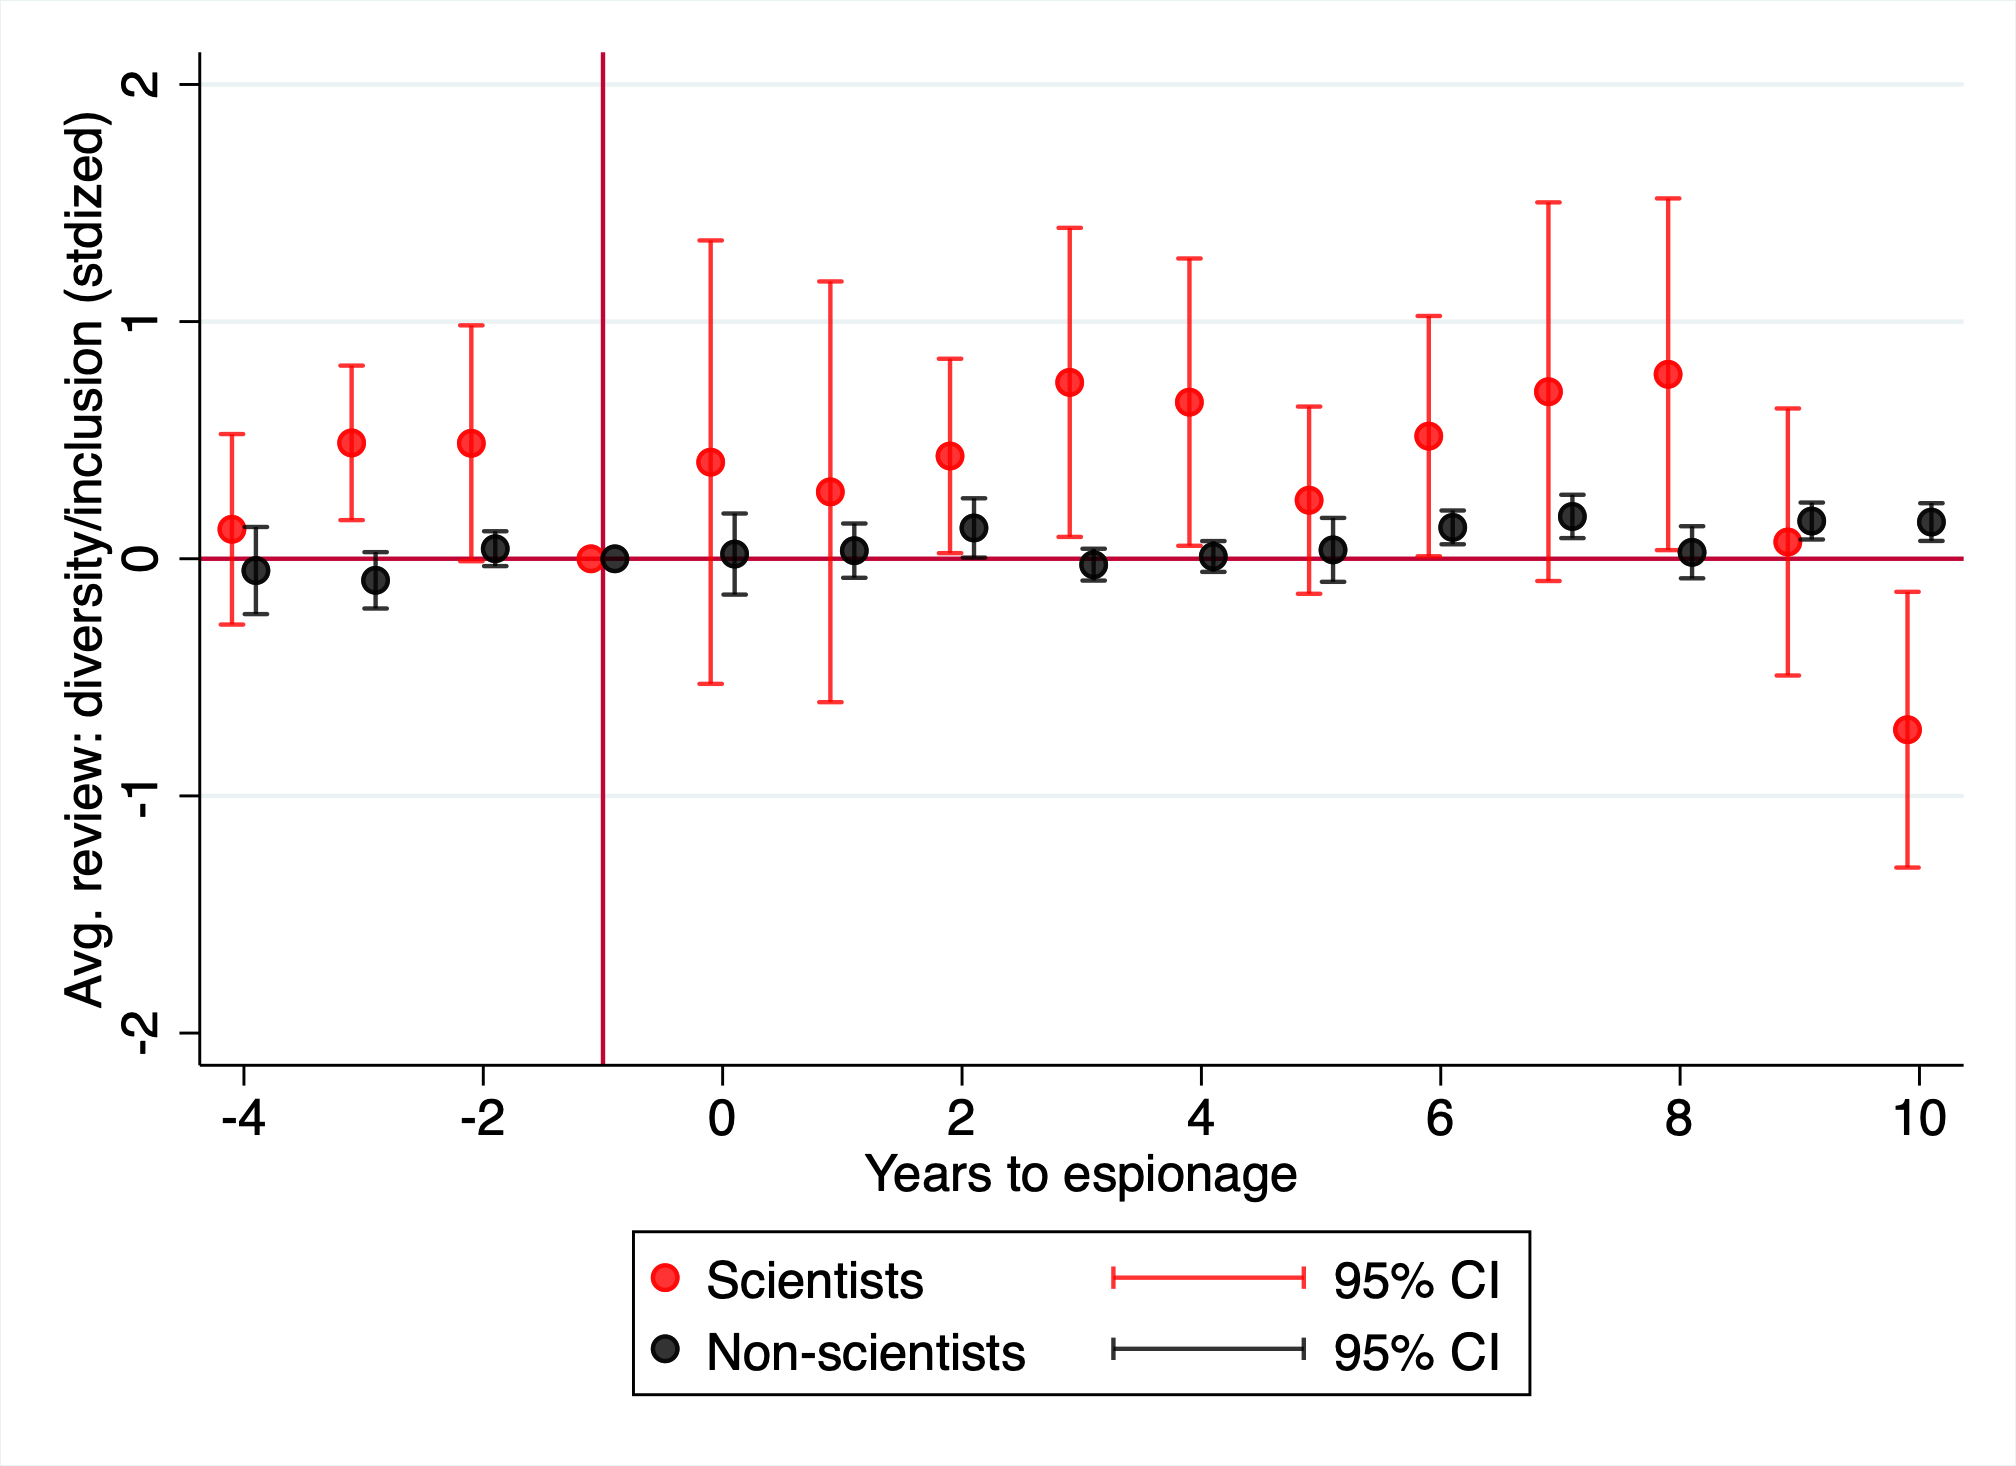
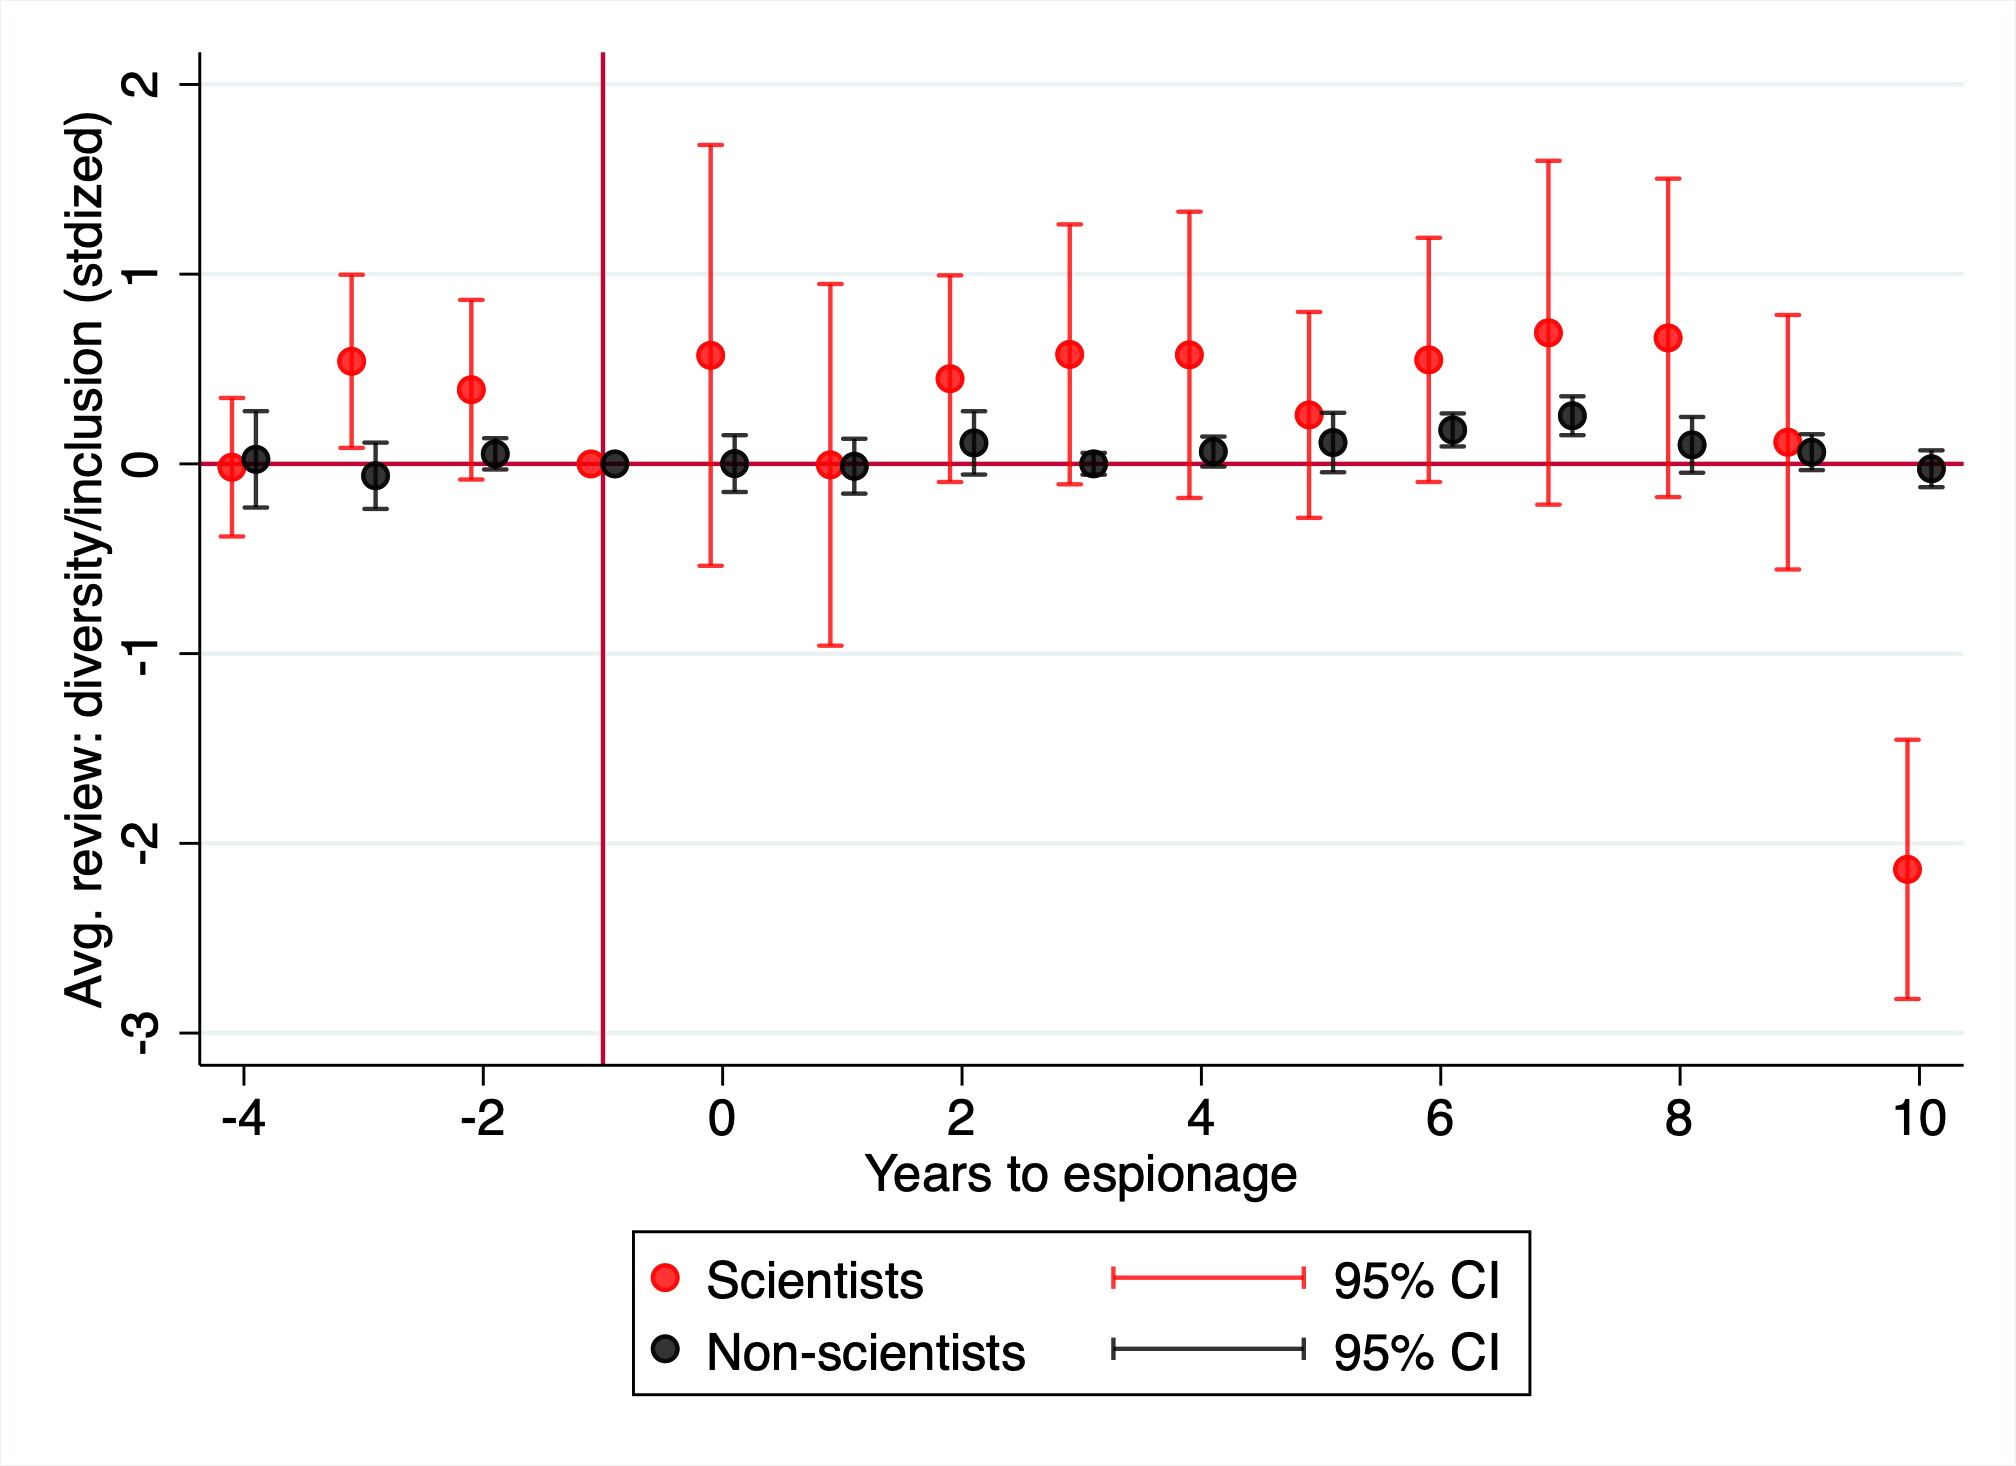
Note: This figure plots coefficients and 95% confidence intervals from two-way fixed effects regressions. Each unit is a firm. The outcome is a measure of diversity and inclusion scores from employee reviews, broken down by scientist vs non-scientists. The review score construction is detailed in 7.2.
Panel A: Any patents
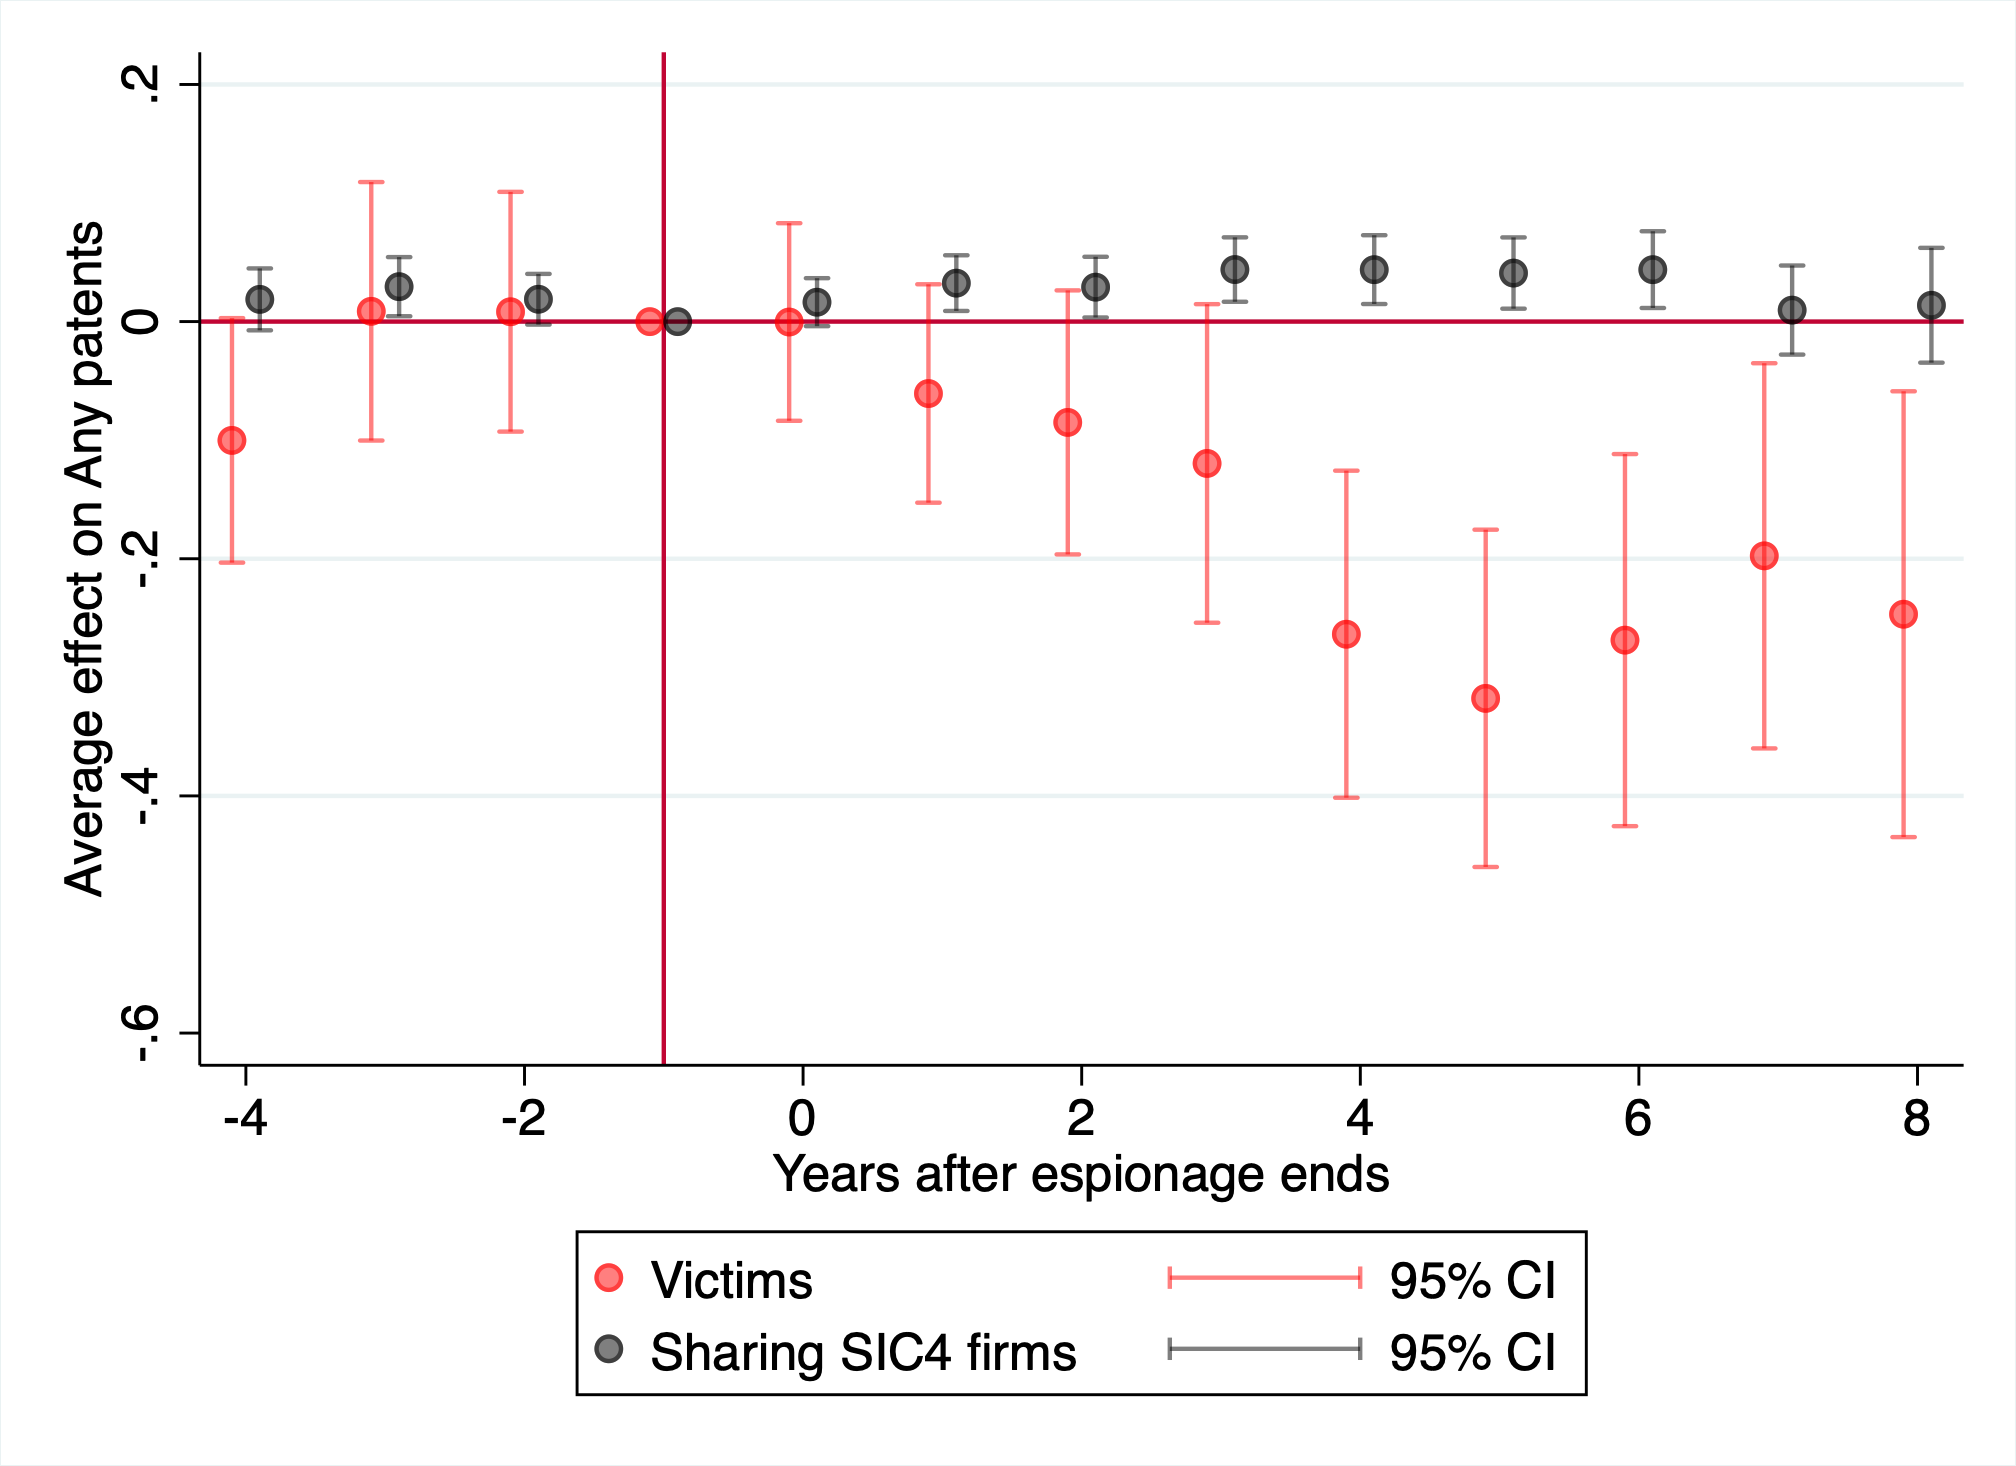
Panel B: Inventor in China Panel C: Inventor outside US
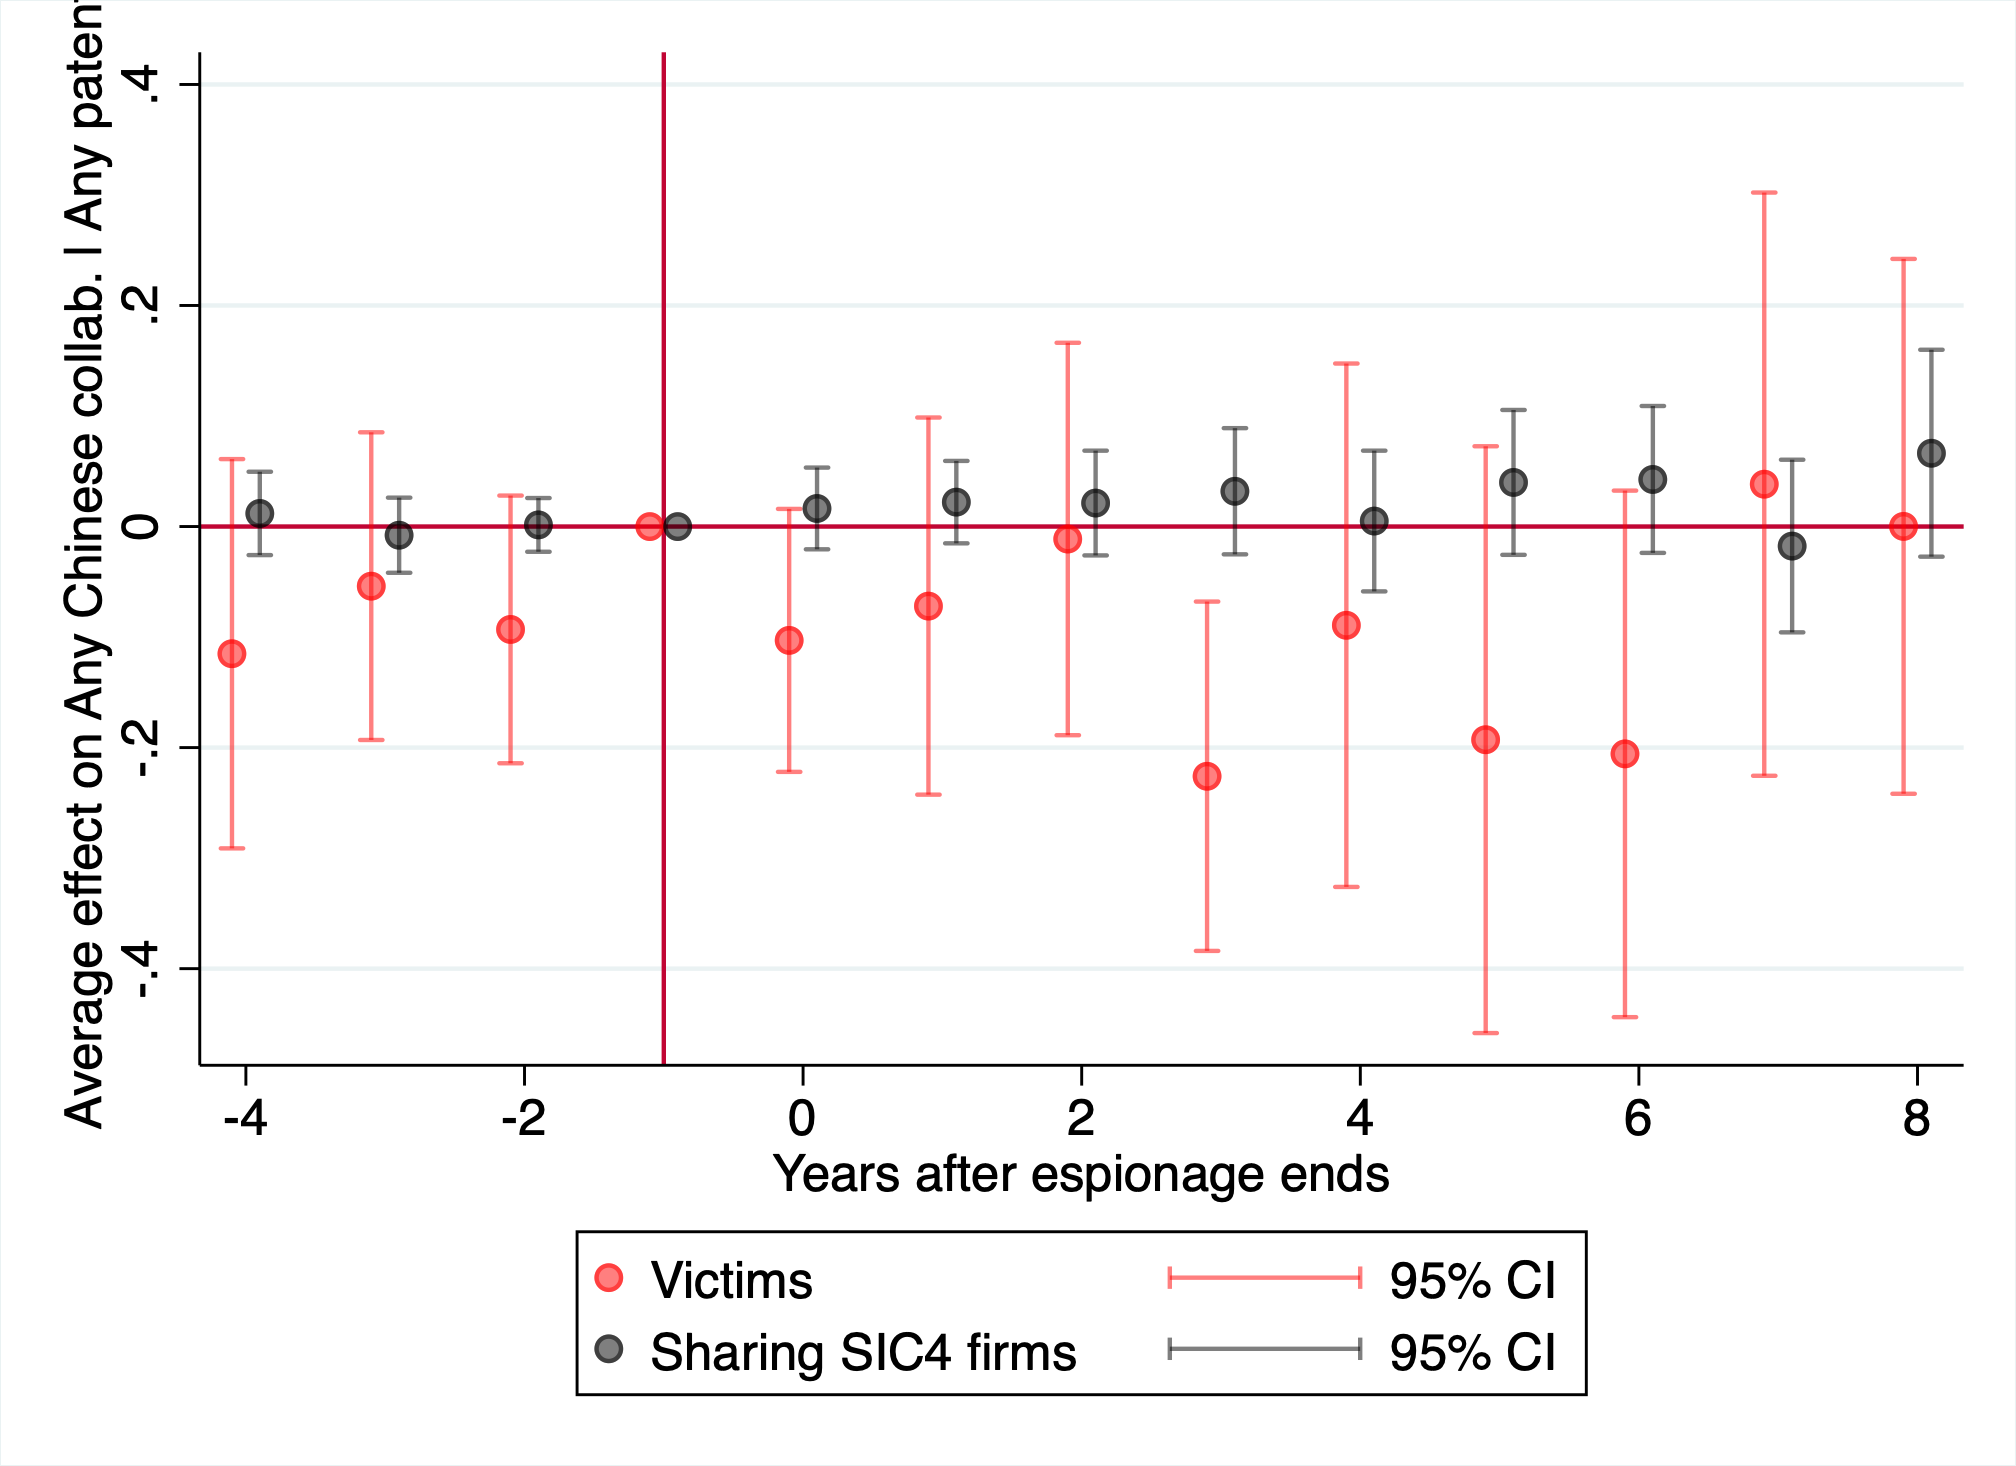
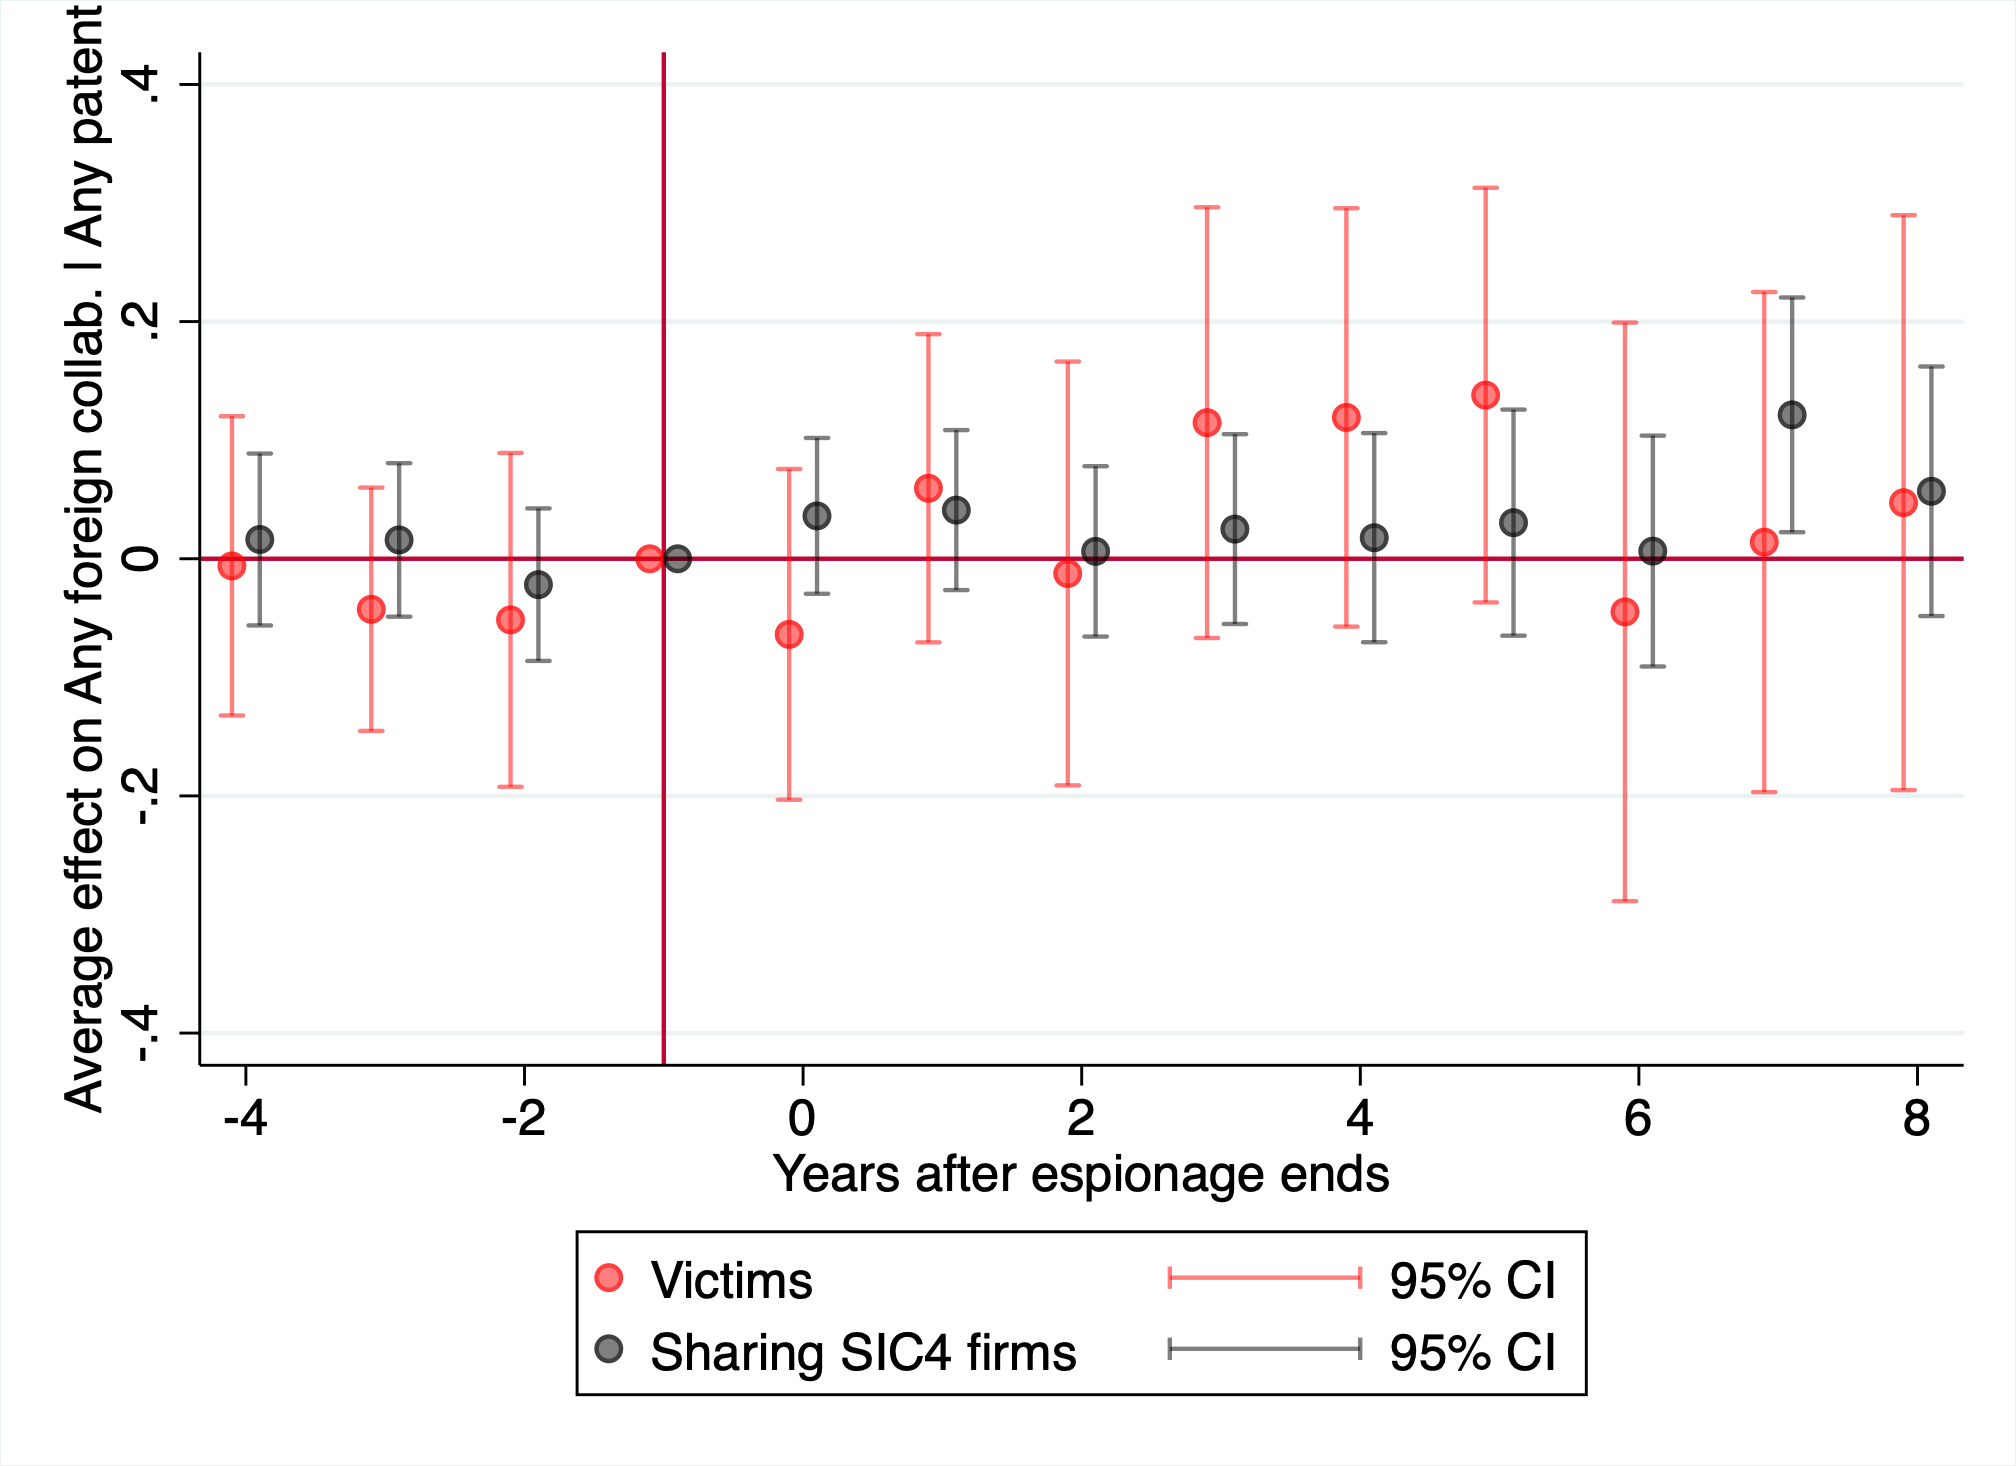
Note: This figure plots coefficients and 95% confidence intervals from triple-difference two-way fixed effects regressions. An event is when an successful economic espionage incident ends. The outcome in Panel A is whether the firm patented in a given year, in Panel B whether the firm patented with an inventor living in China conditional on filing any patents, in Panel C whether the firm patented with an inventor living outside the US conditional on filing any patents. The sample consists of all firms in treated industries (SIC-4 codes ever targeted for espionage) and “nearby” never-treated industries (industries sharing an SIC-3 code with treated SIC-4 industries). Coefficients for event-time indicators are plotted in black, while triple difference coefficients for victim firms are plotted in red. Standard errors are clustered at the firm level.
Panel A: Any patents Panel B: Inventor outside
US
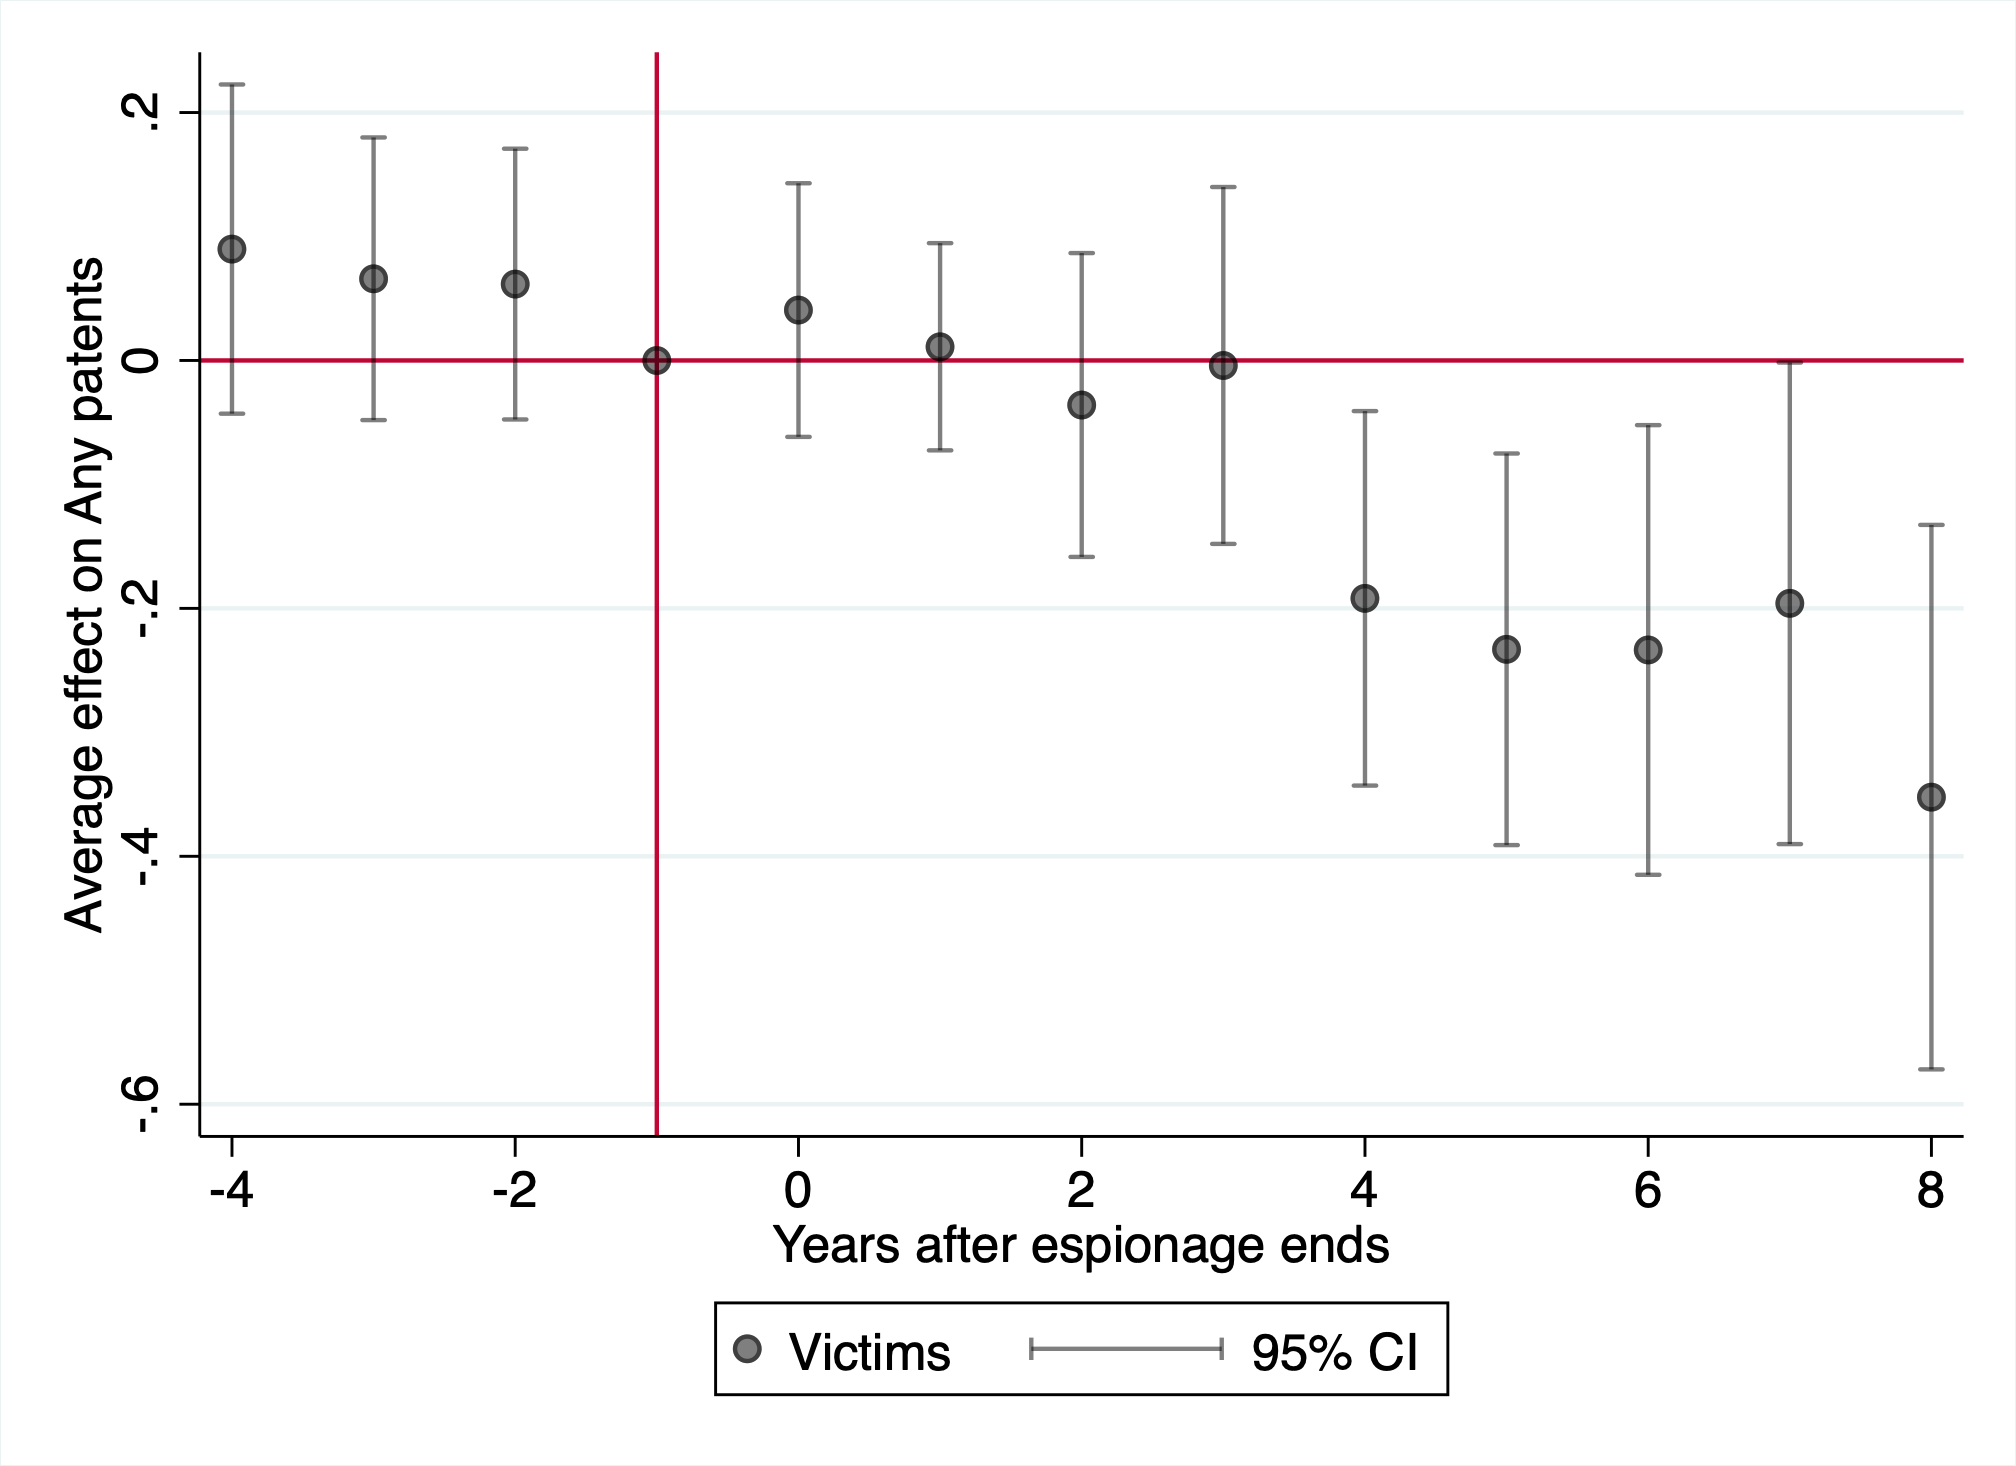
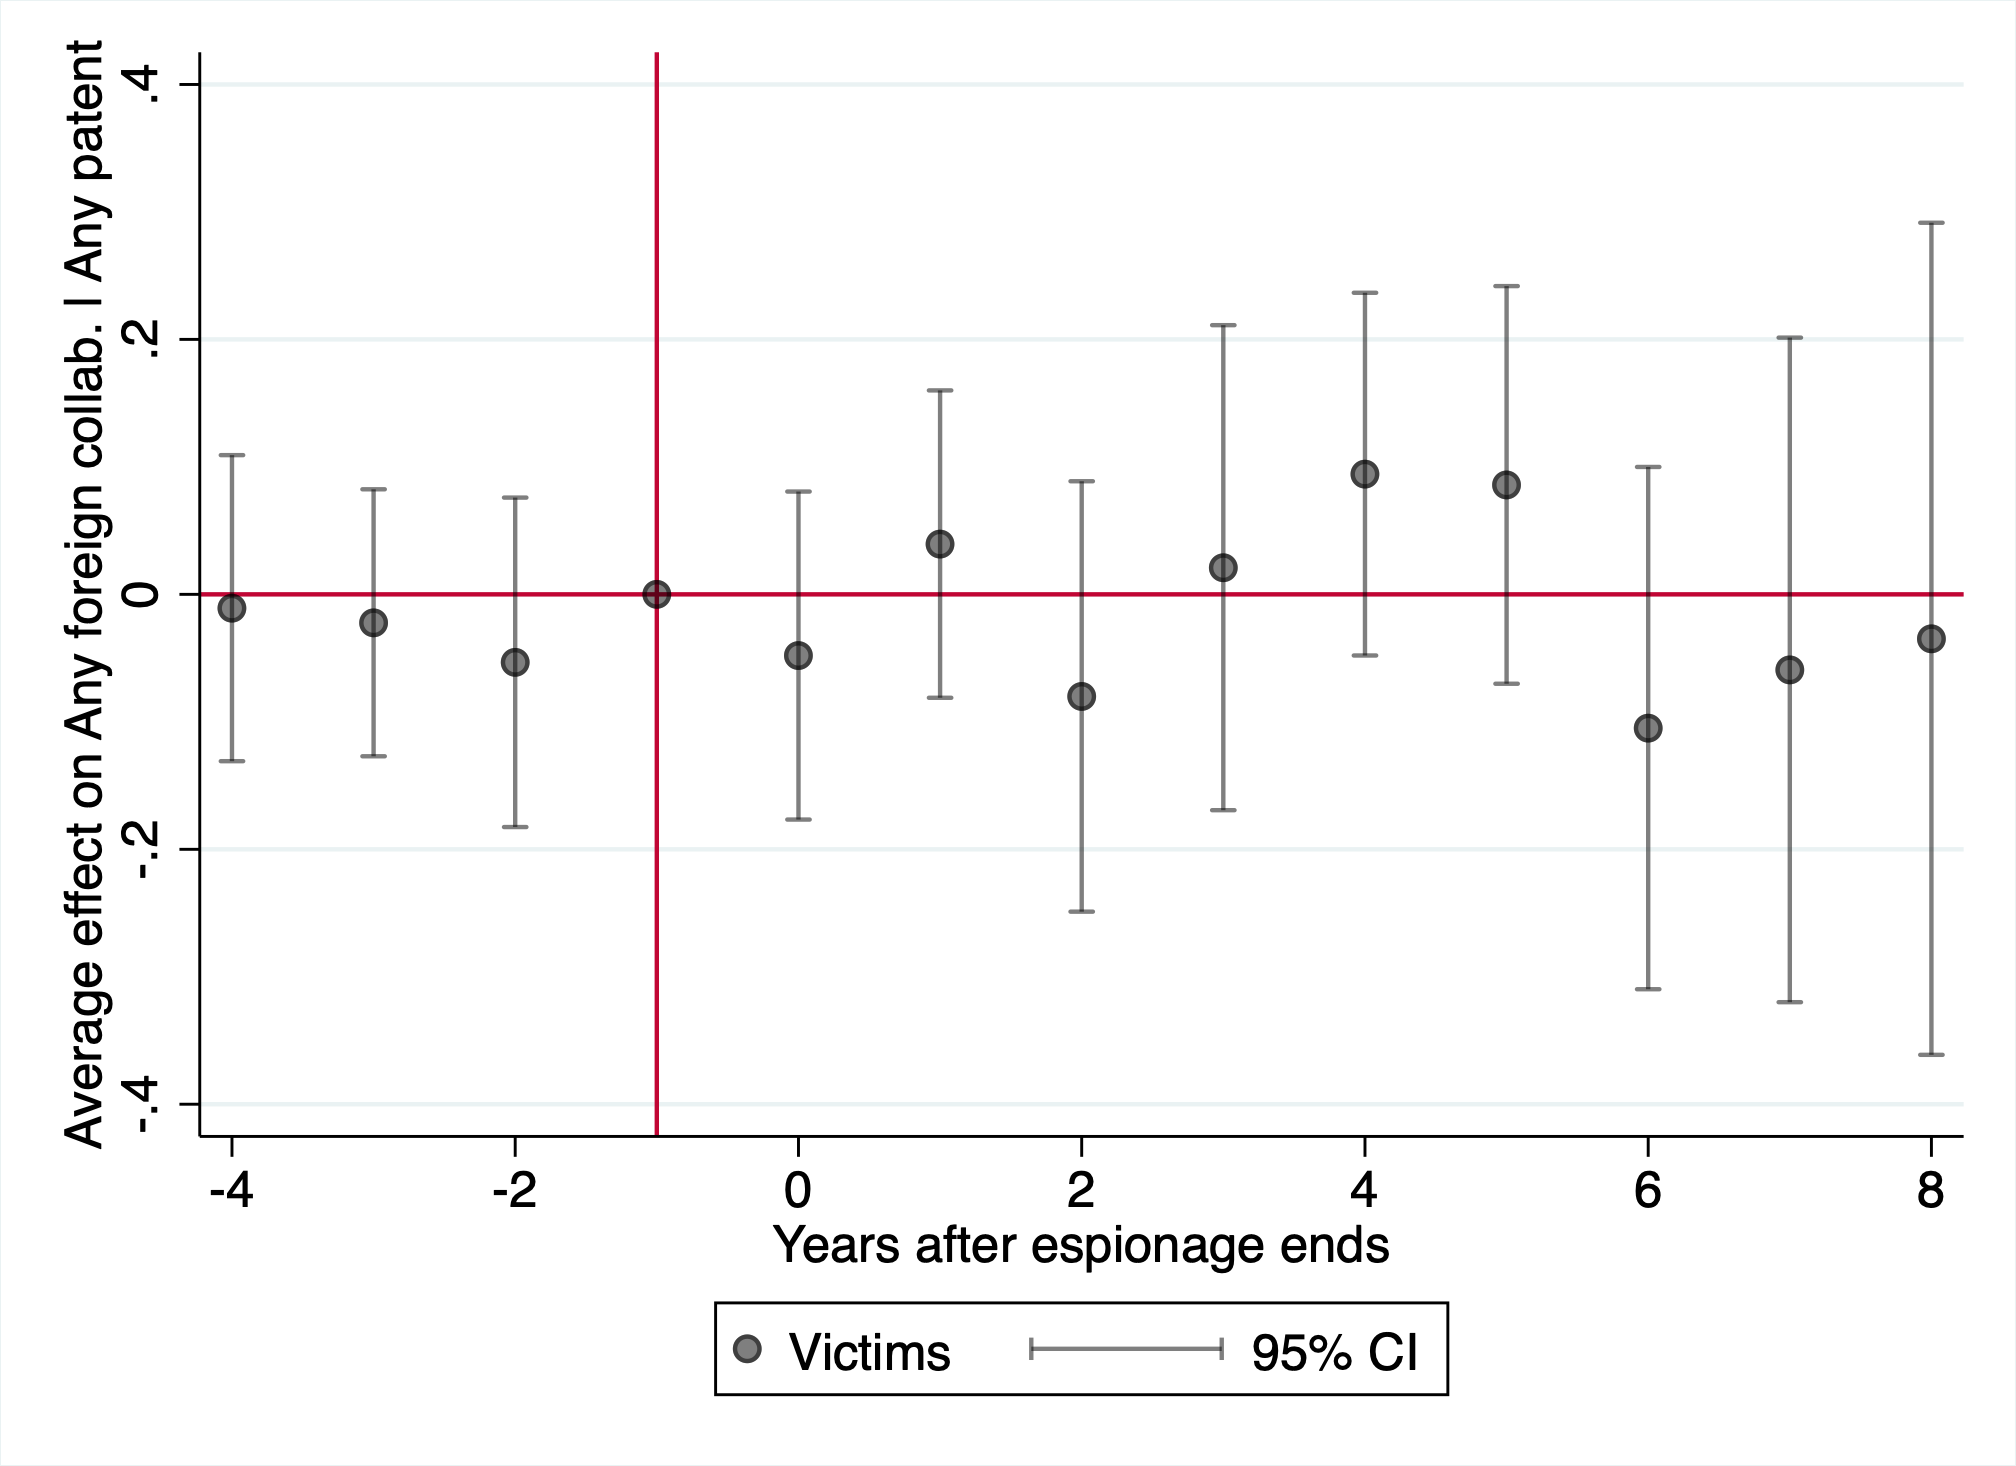
Panel C: Citations per patent
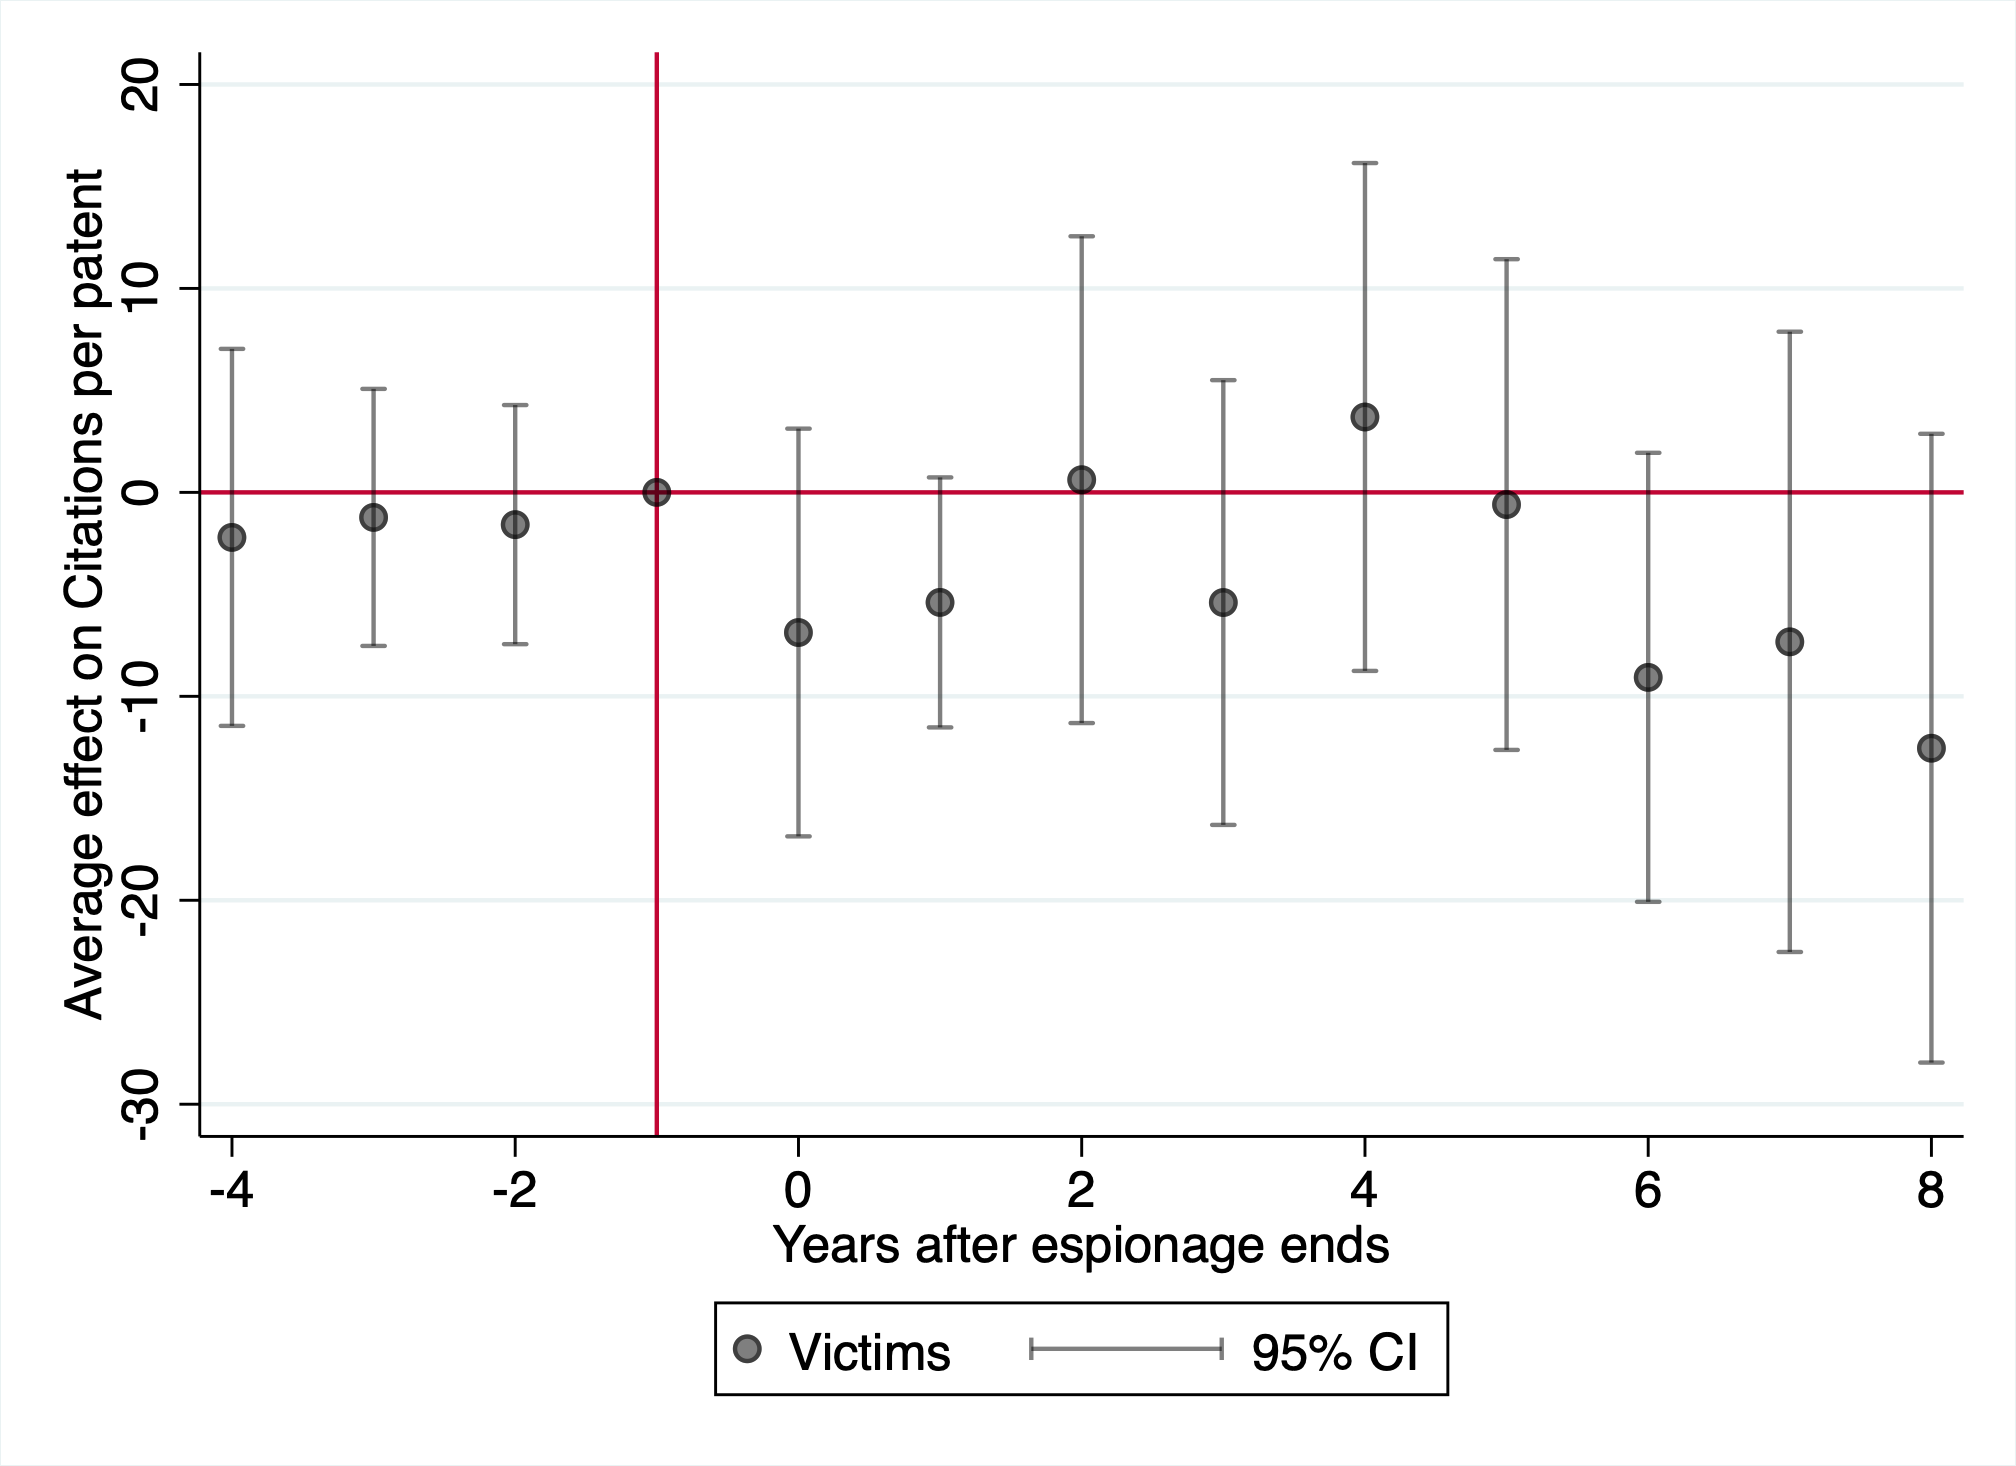
Note: This figure plots coefficients and 95% confidence intervals from two-way fixed effects regressions. An event is when an successful economic espionage incident ends. The outcome in Panel A is whether the firm patented in a given year, in Panel B whether the firm patented with an inventor outside the US, in Panel C how many citations each patent by the firm receives, normalized by the patenting year. Inventor location is inferred from the address on a patent application. Panels B-C measure outcomes conditional on the firm filing any patent at all. Standard errors are clustered at the firm level.
Panel A: All employees
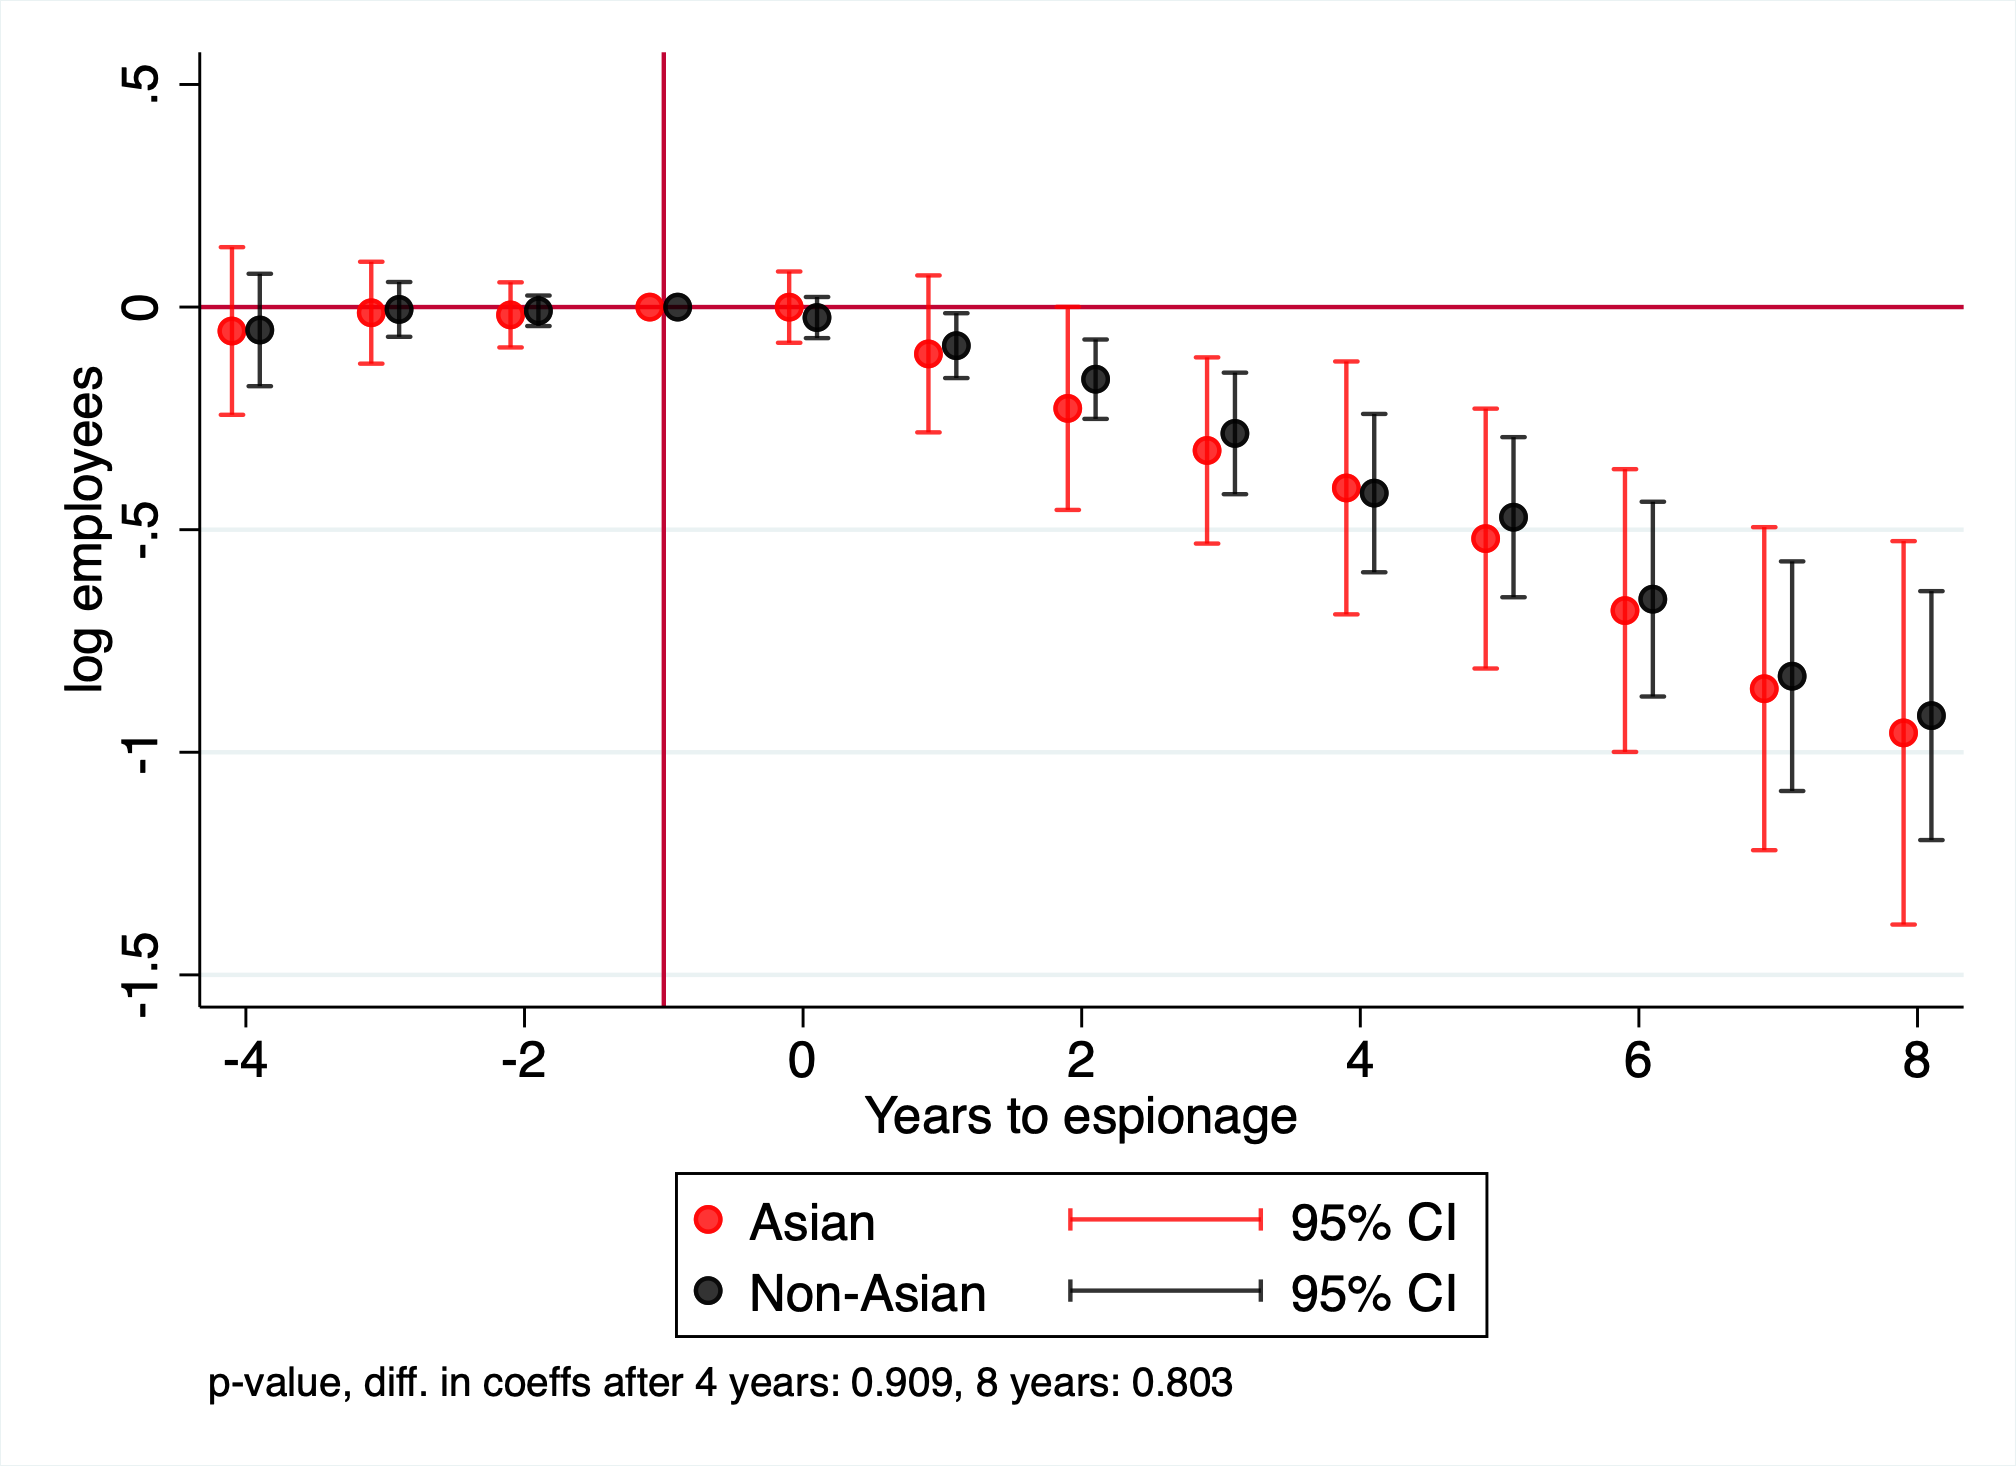
Panel B: Scientists
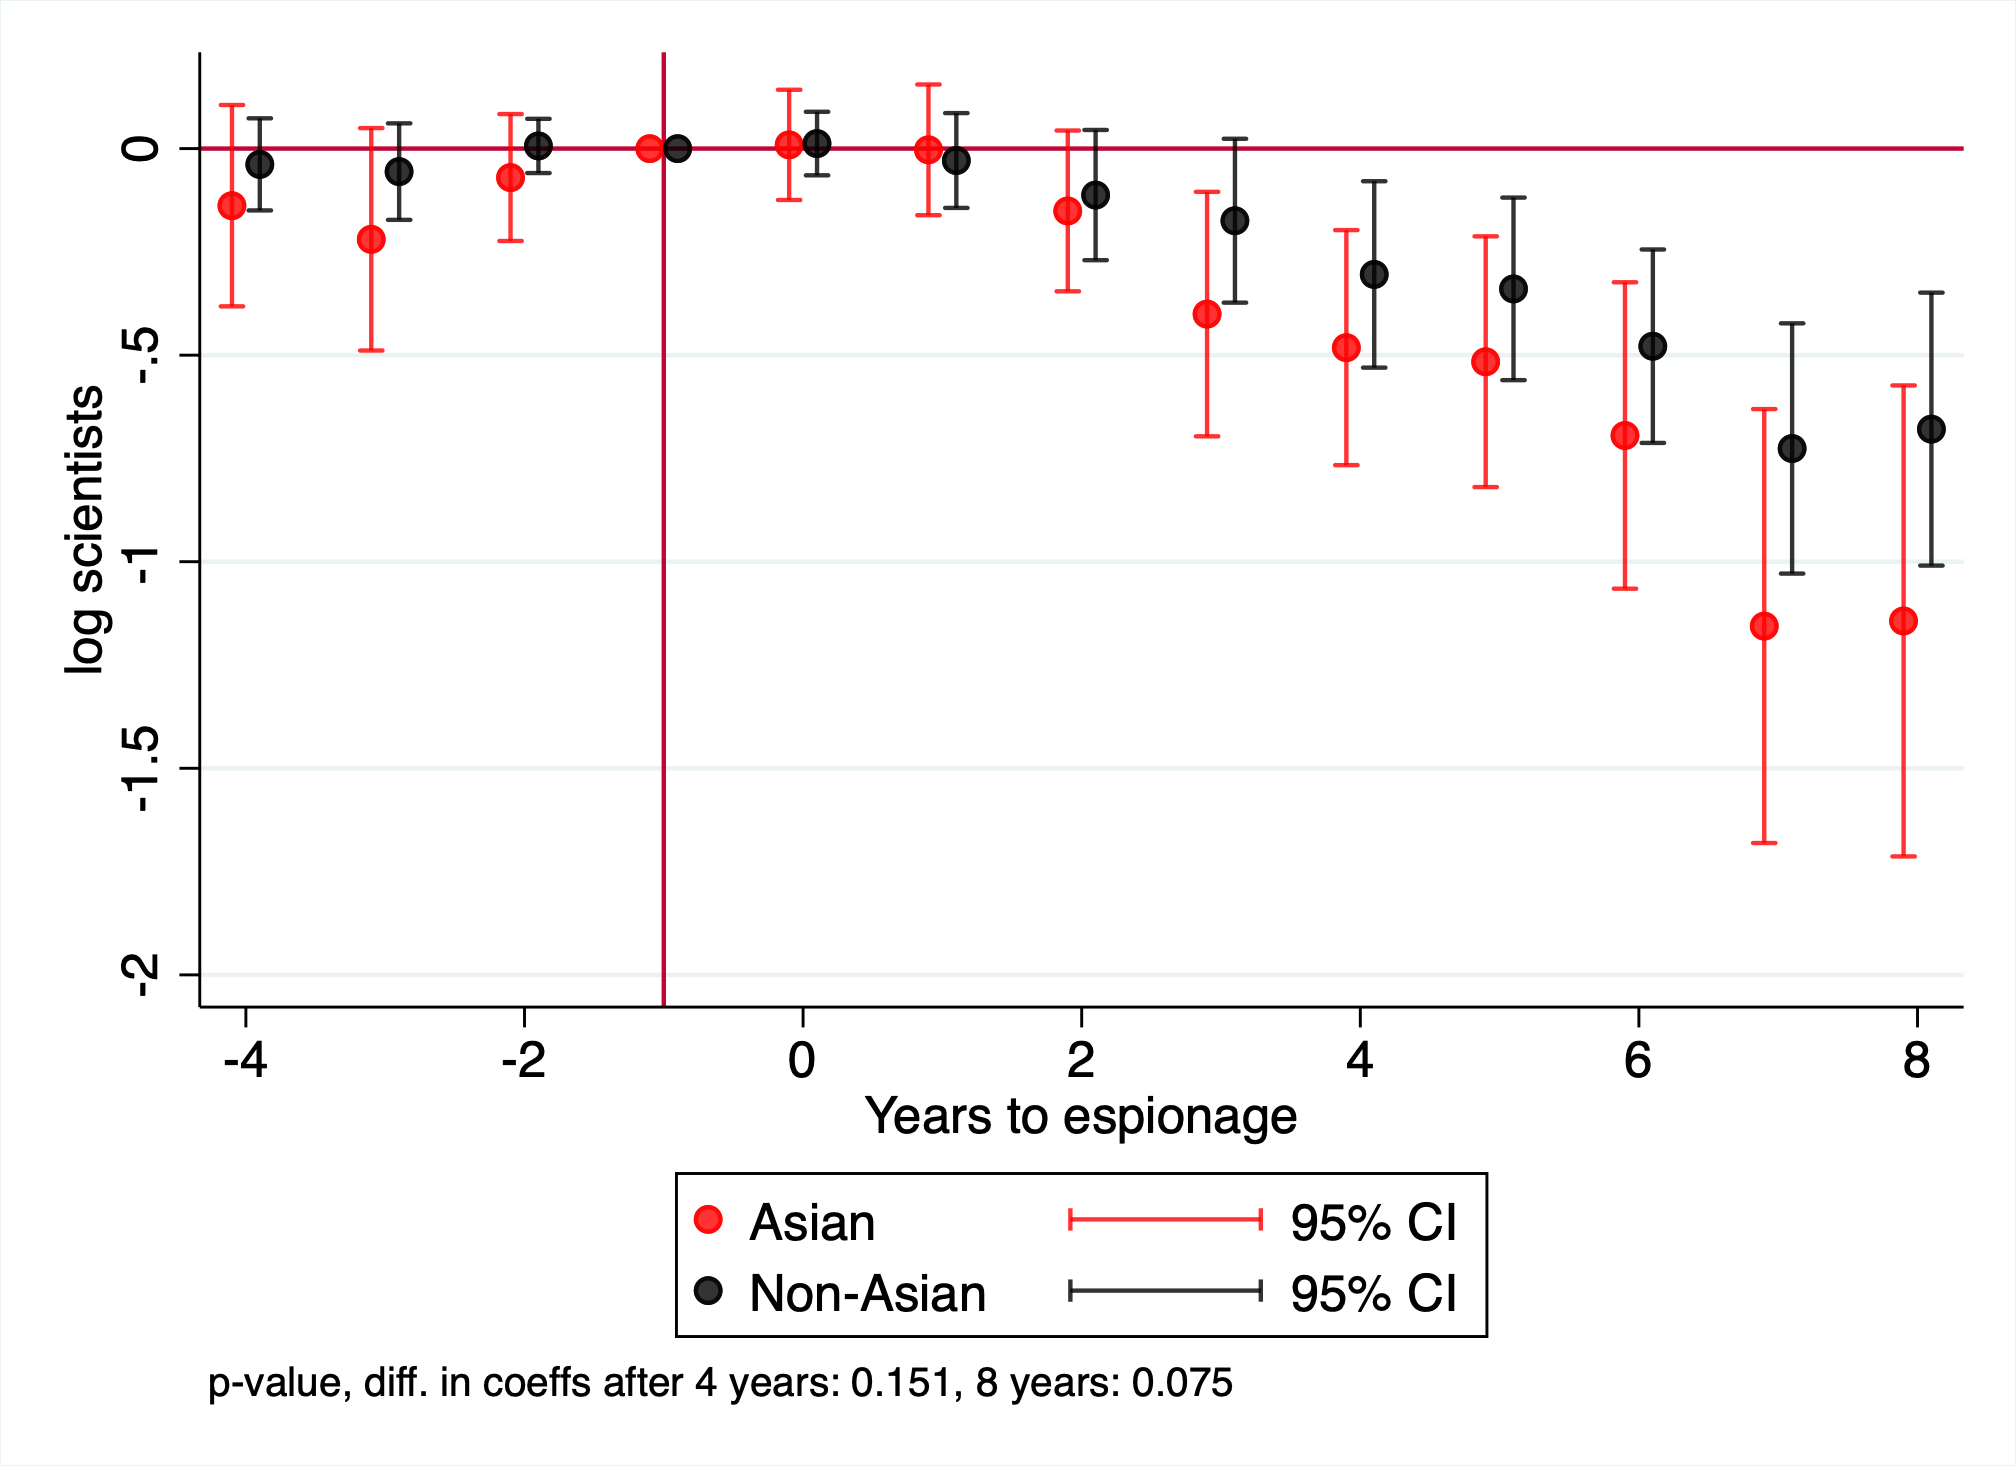
Note: This figure plots coefficients and 95% confidence intervals from two-way fixed effects regressions. An event is when an successful economic espionage incident ends. The outcome in Panel A is the log(employees) and in Panel B the log(scientists) employed by the firm belonging to each racial background. Plotted in red are coefficient estimates for Asians and in black, coefficient estimates for non-Asians. Ethnicity classifications are drawn from name analysis done by Revelio Labs, while scientist job classification is based on job titles. Standard errors are clustered at the firm level.
Panel A: Asian employees Panel B: Non-Asian employees
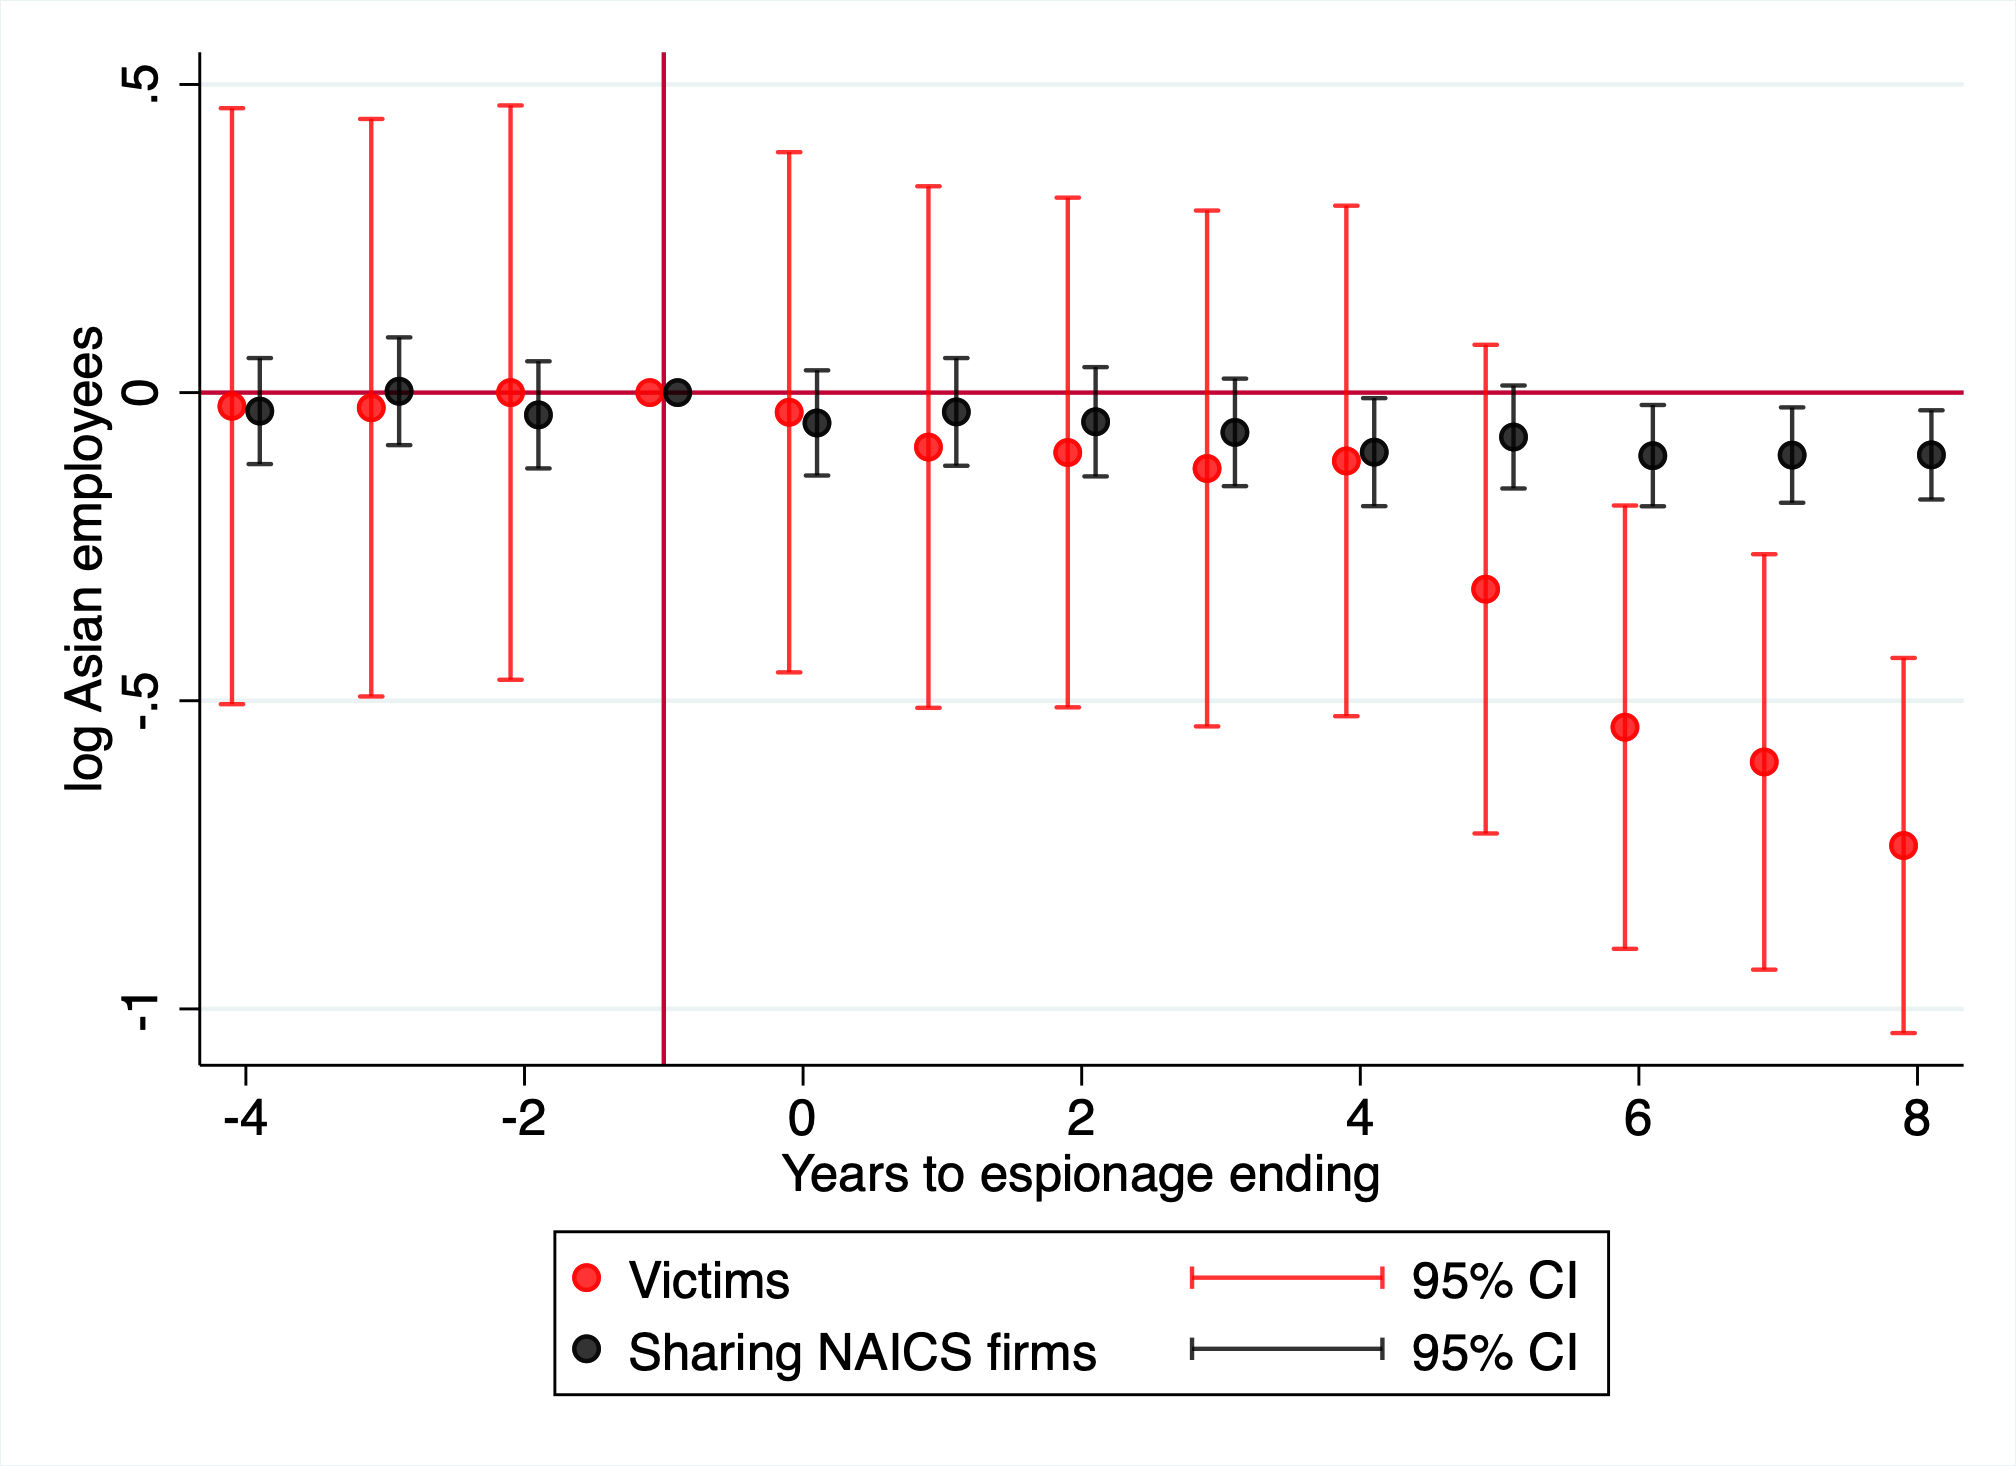
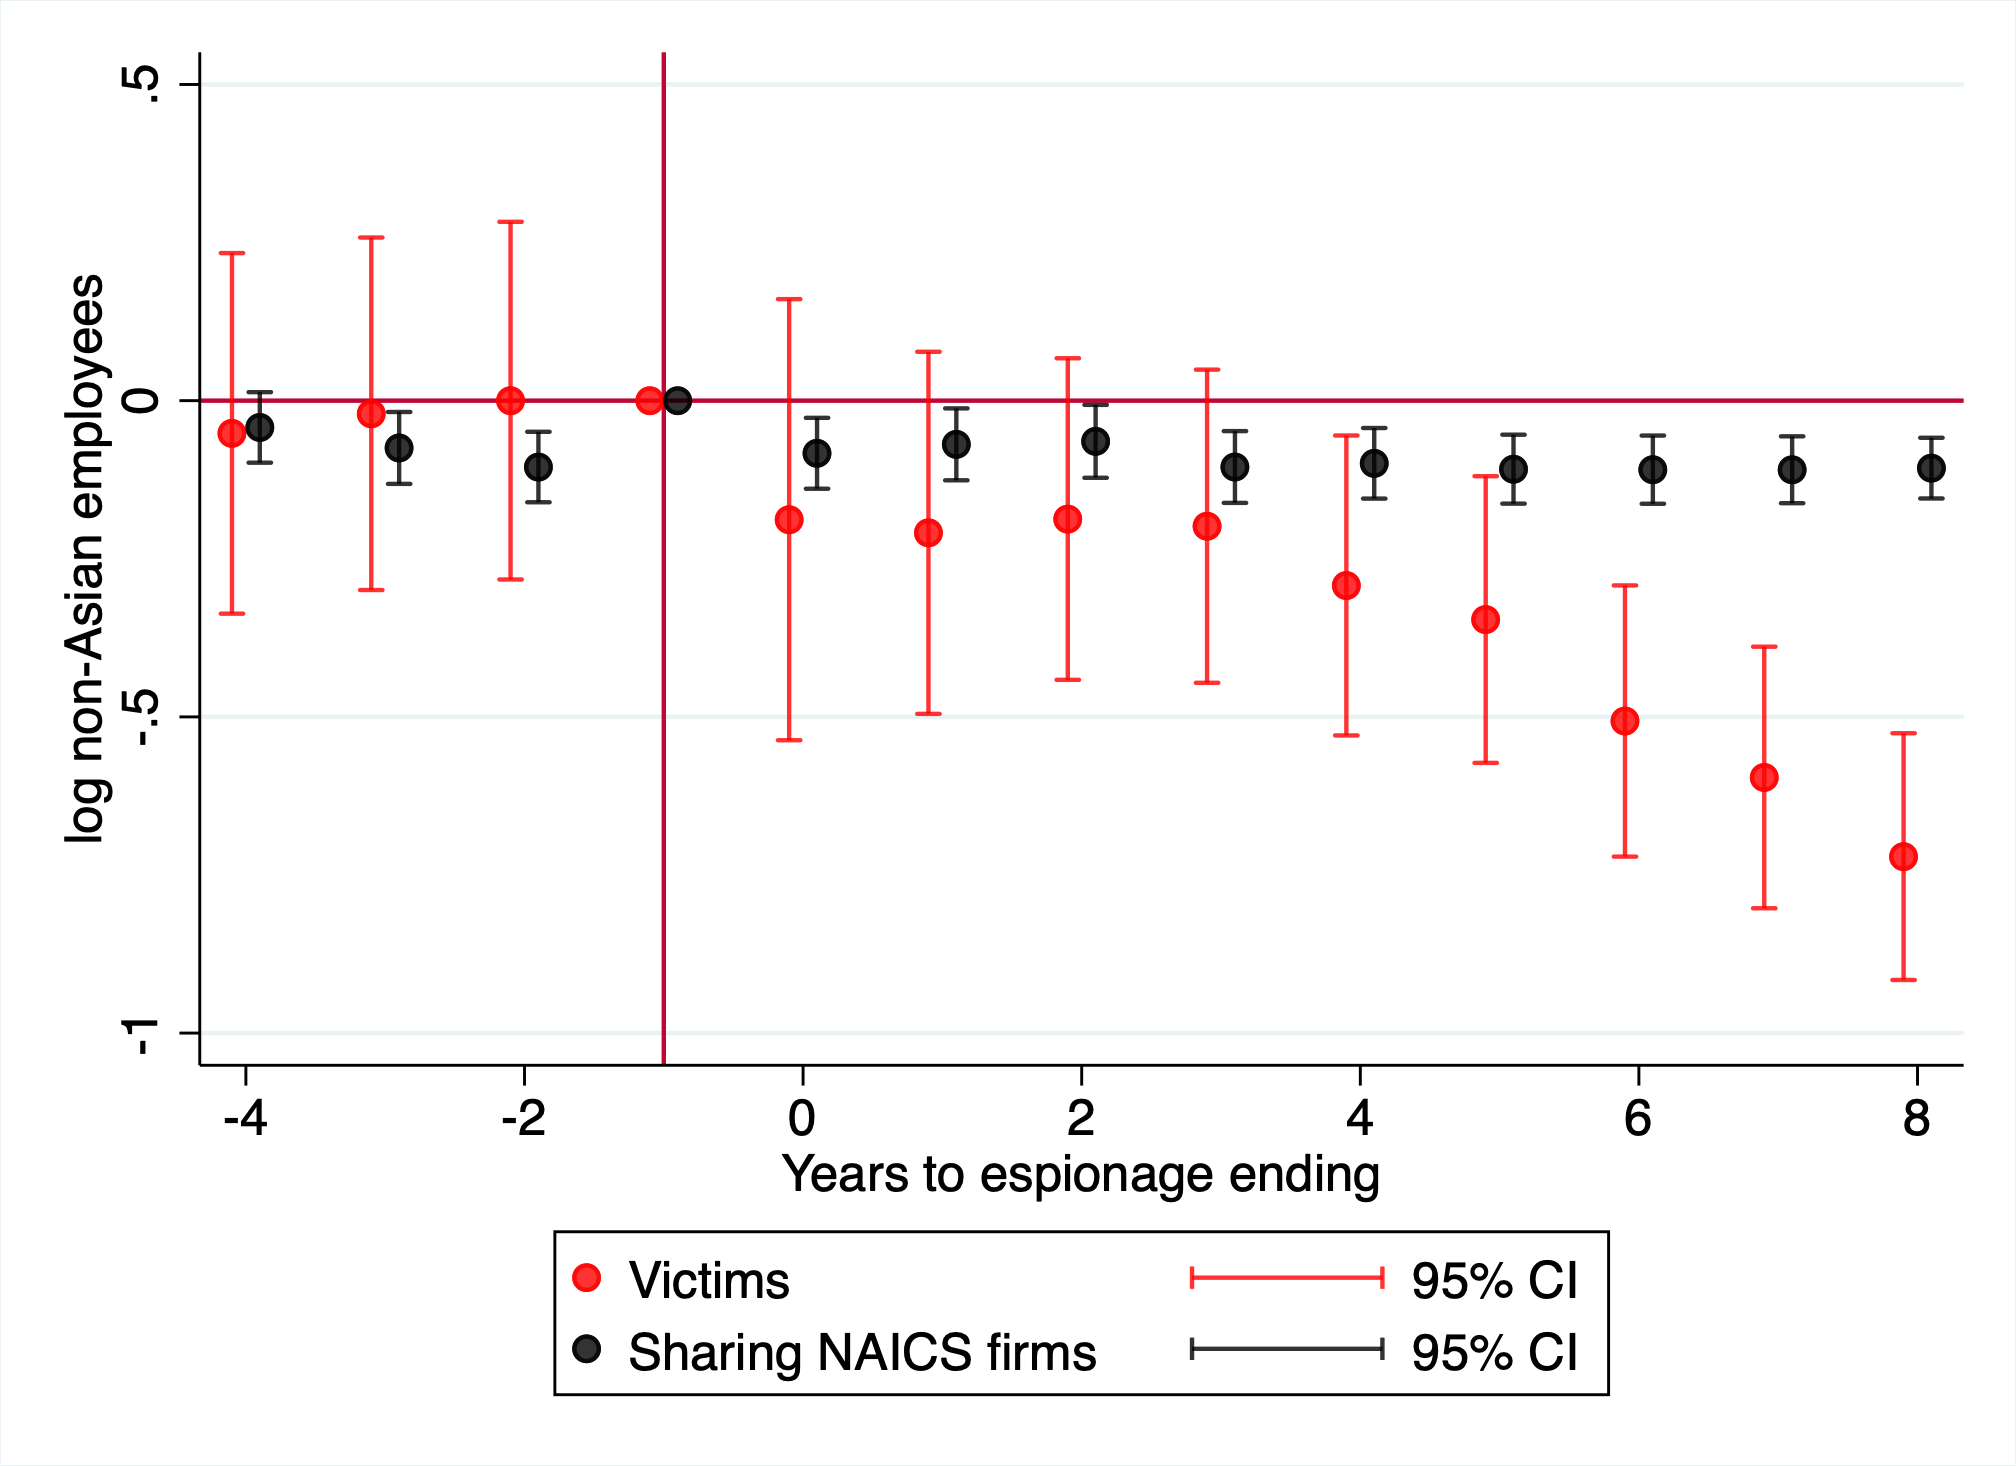
Panel C: Asian scientists Panel D: Non-Asian scientists
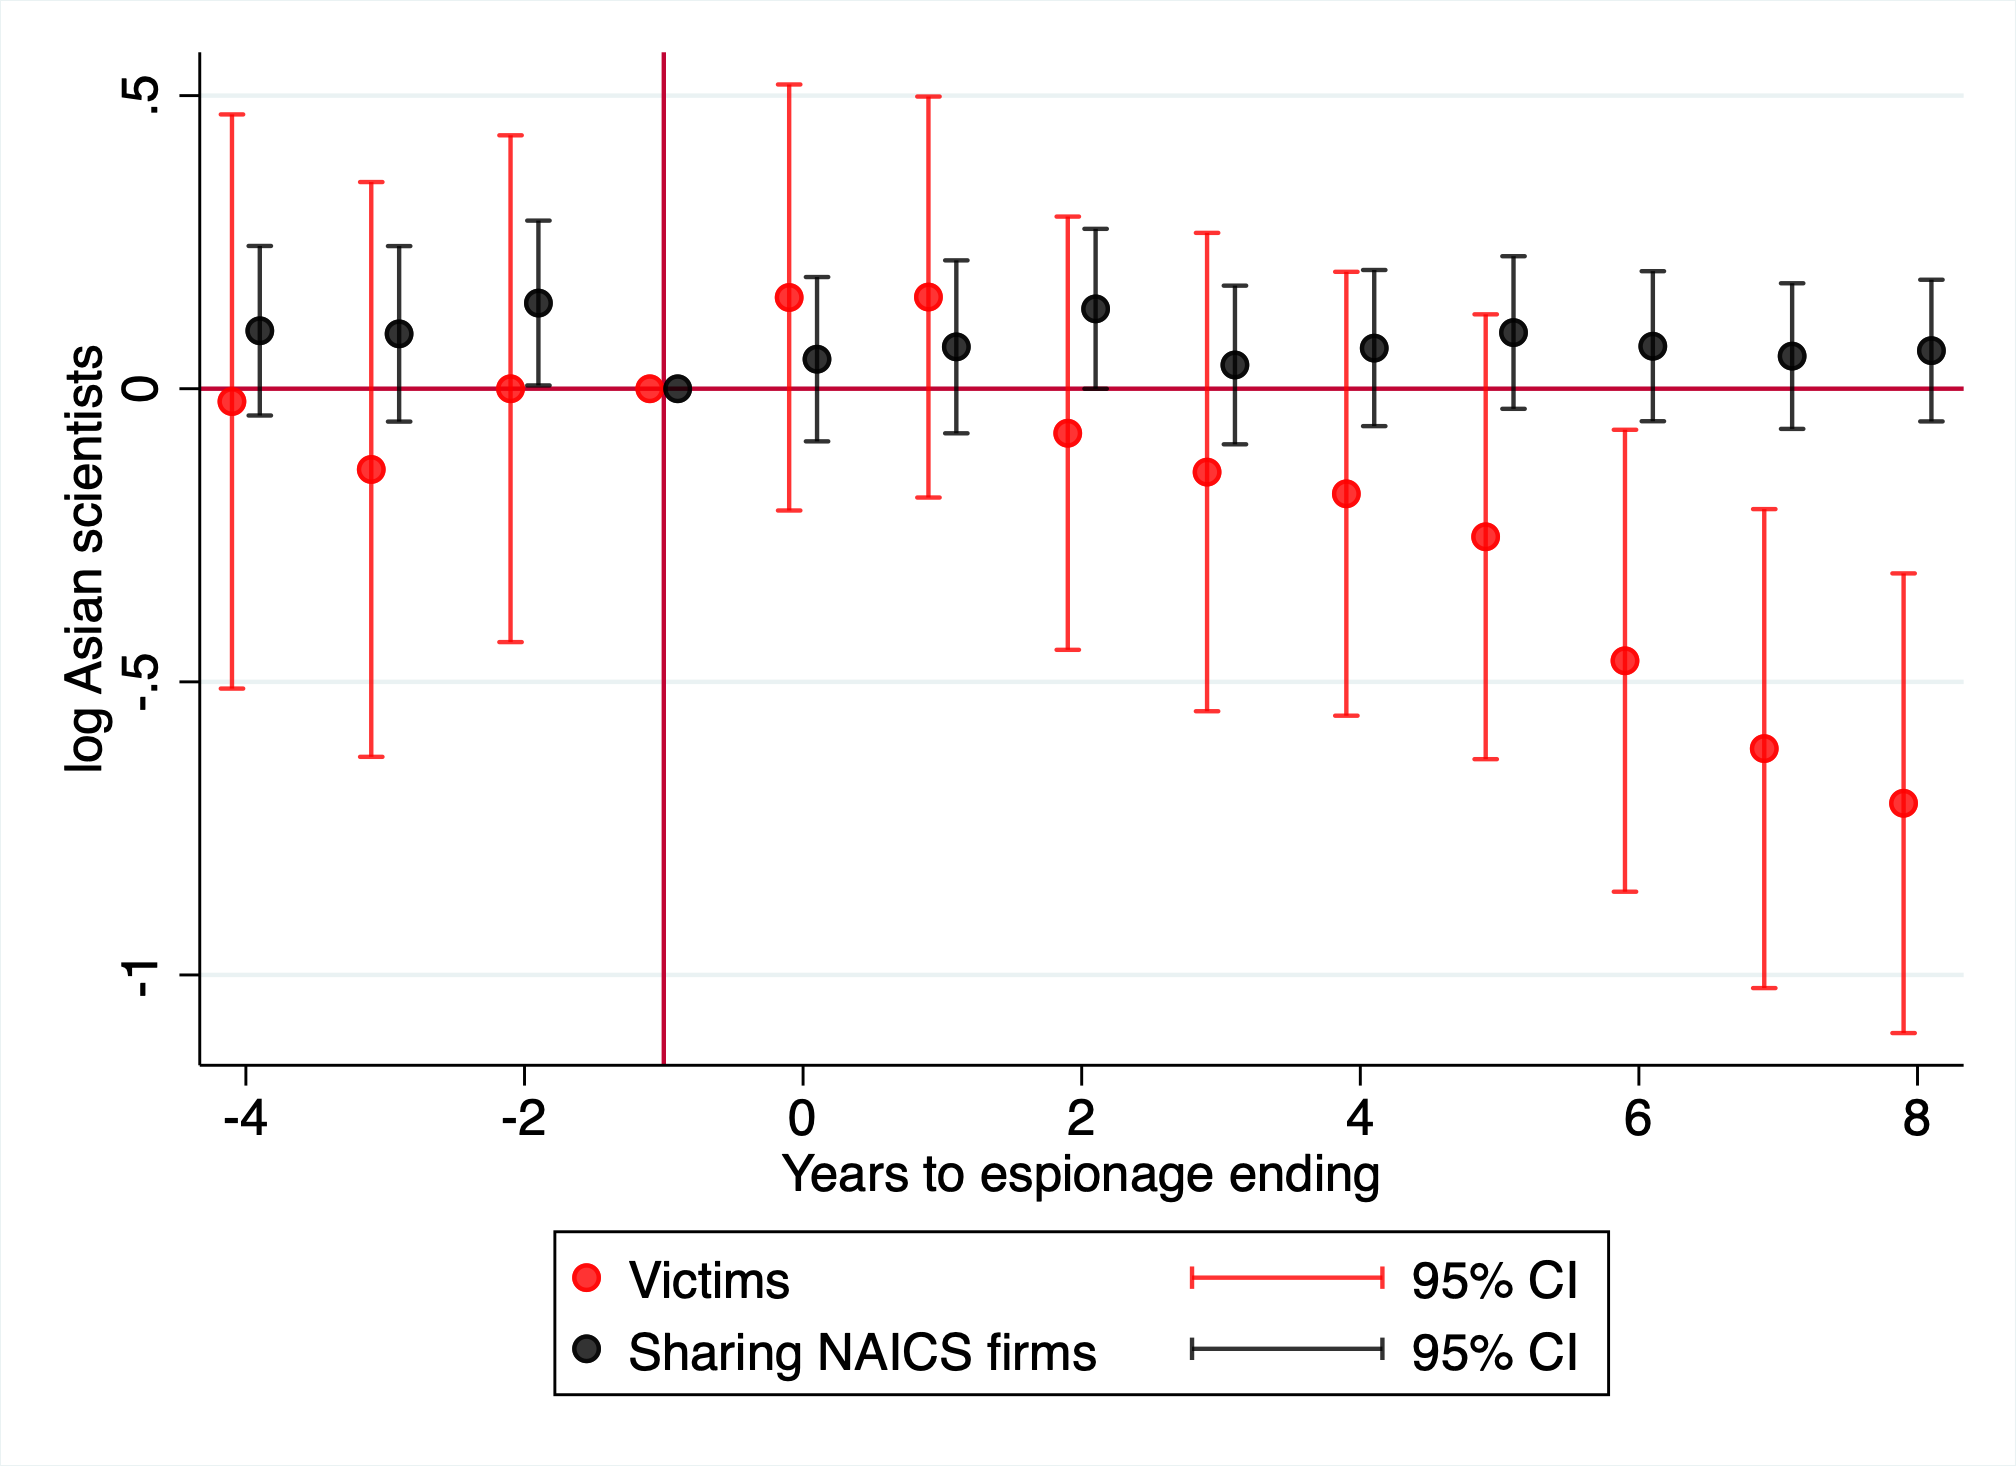
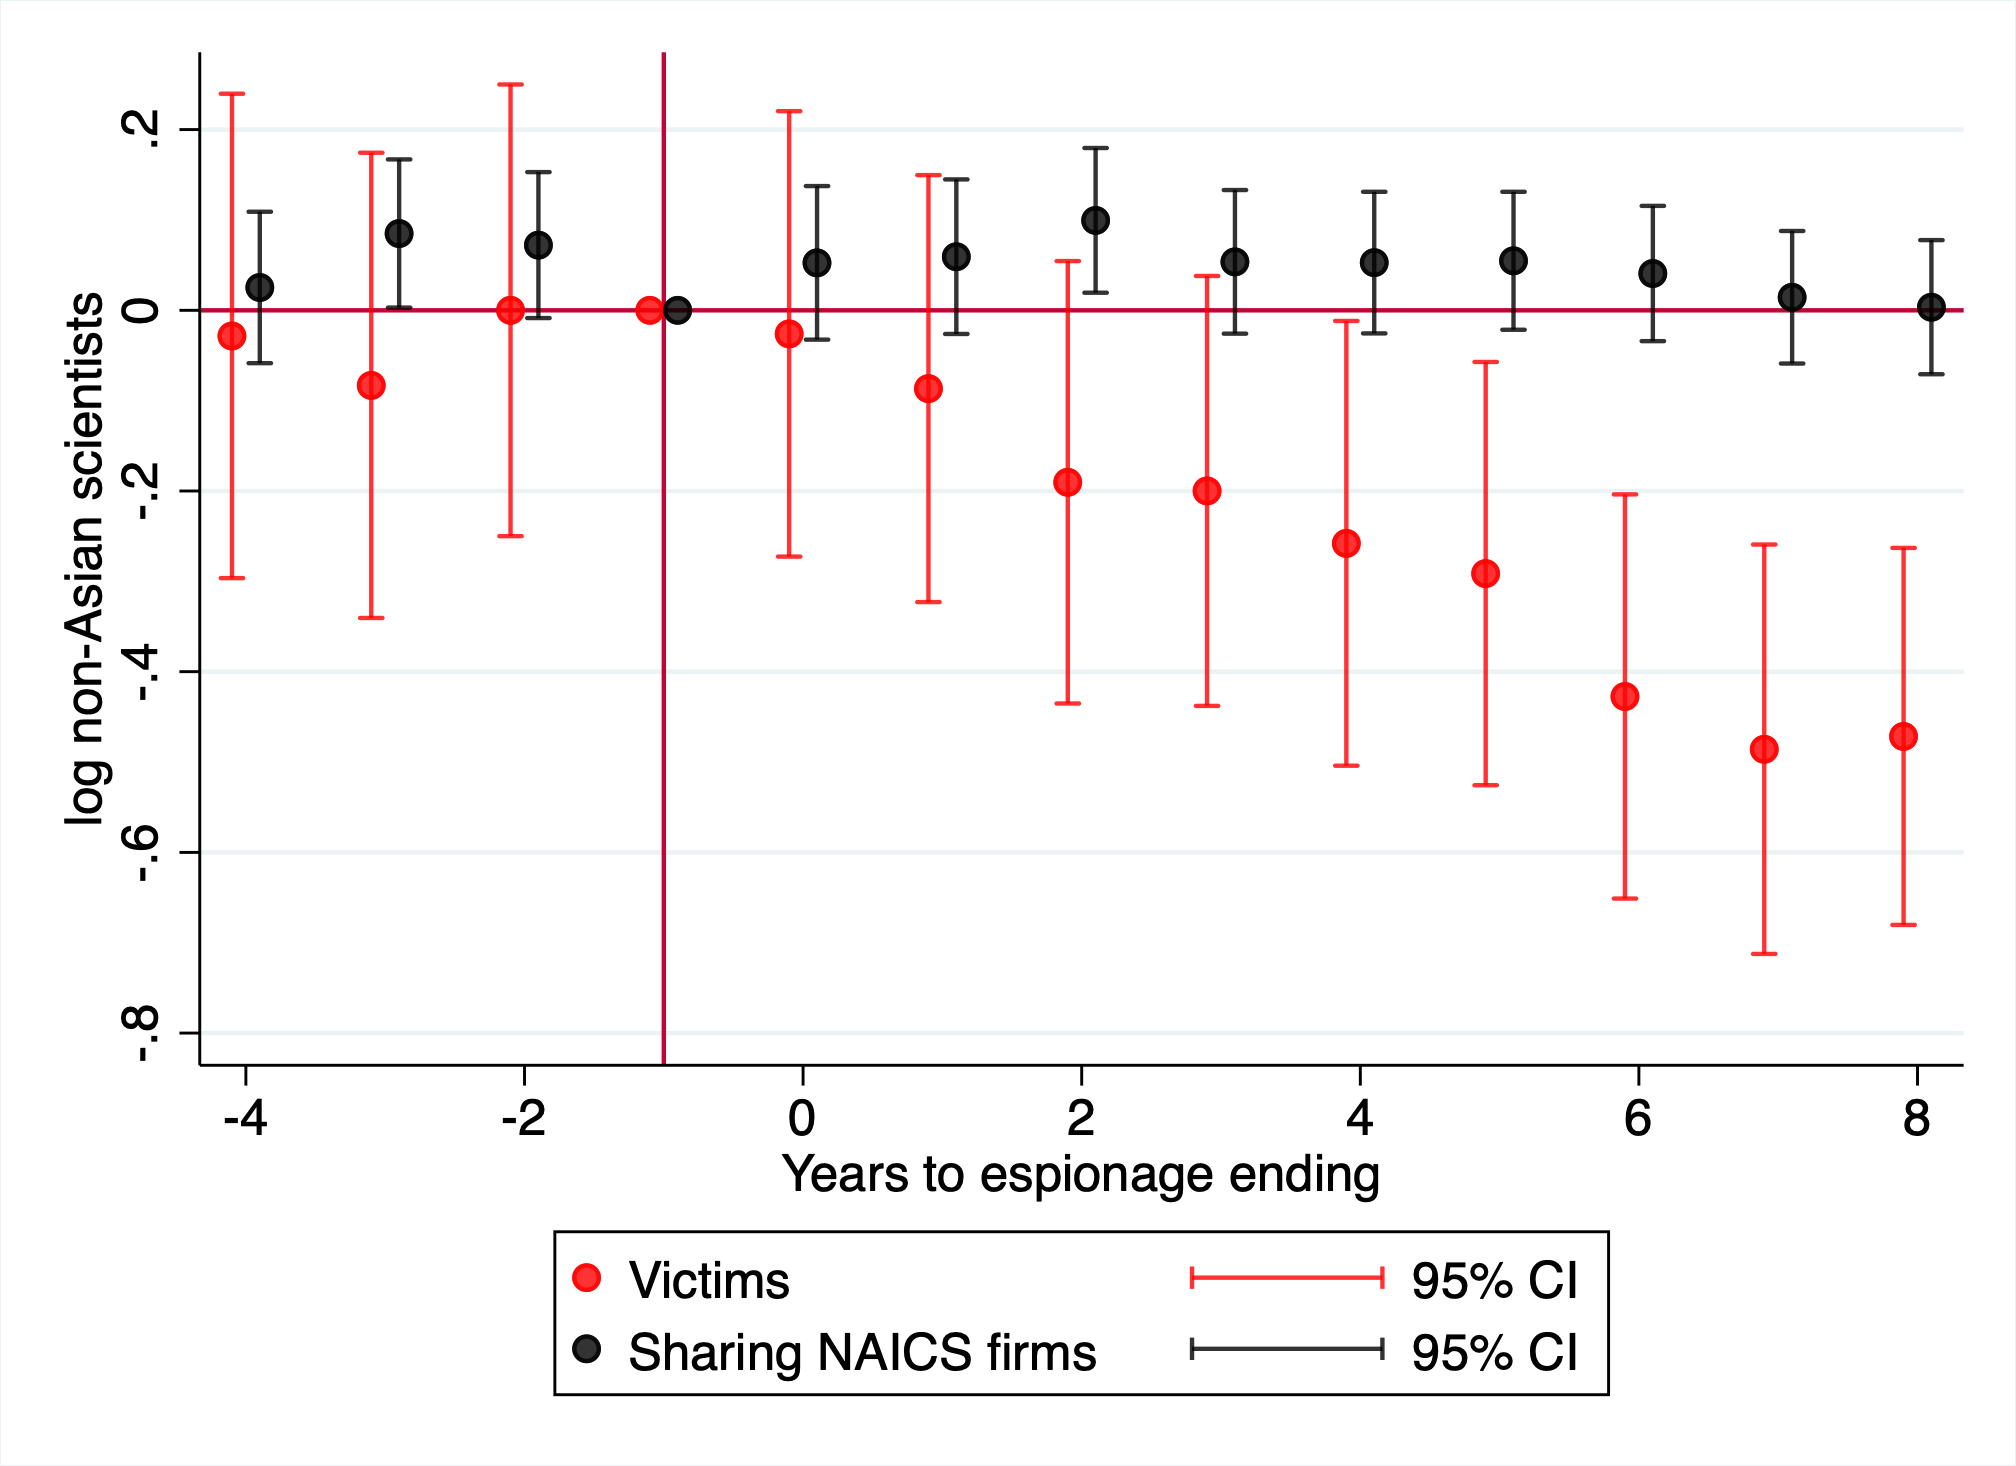
Note: This figure plots coefficients and 95% confidence intervals from a triple differences two-way fixed effects regressions. An event is when an successful economic espionage incident ends. Ethnicity classifications are drawn from name analysis done by Revelio Labs, while scientist job classification is based on job titles. The outcome in each panel is the logged count of the respective employee type. The sample consists of all firms in treated industries (NAICS-6 codes ever targeted for espionage) and all firms in “nearby” never-treated industries (industries sharing an NAICS-4 code with treated NAICS-6 industries). Coefficients for event-time indicators are plotted in black, while triple difference coefficients for victim firms are plotted in red. Standard errors are clustered at the firm level.
Panel A: I[segment in China] Panel B: HHI, sales across
geo. markets
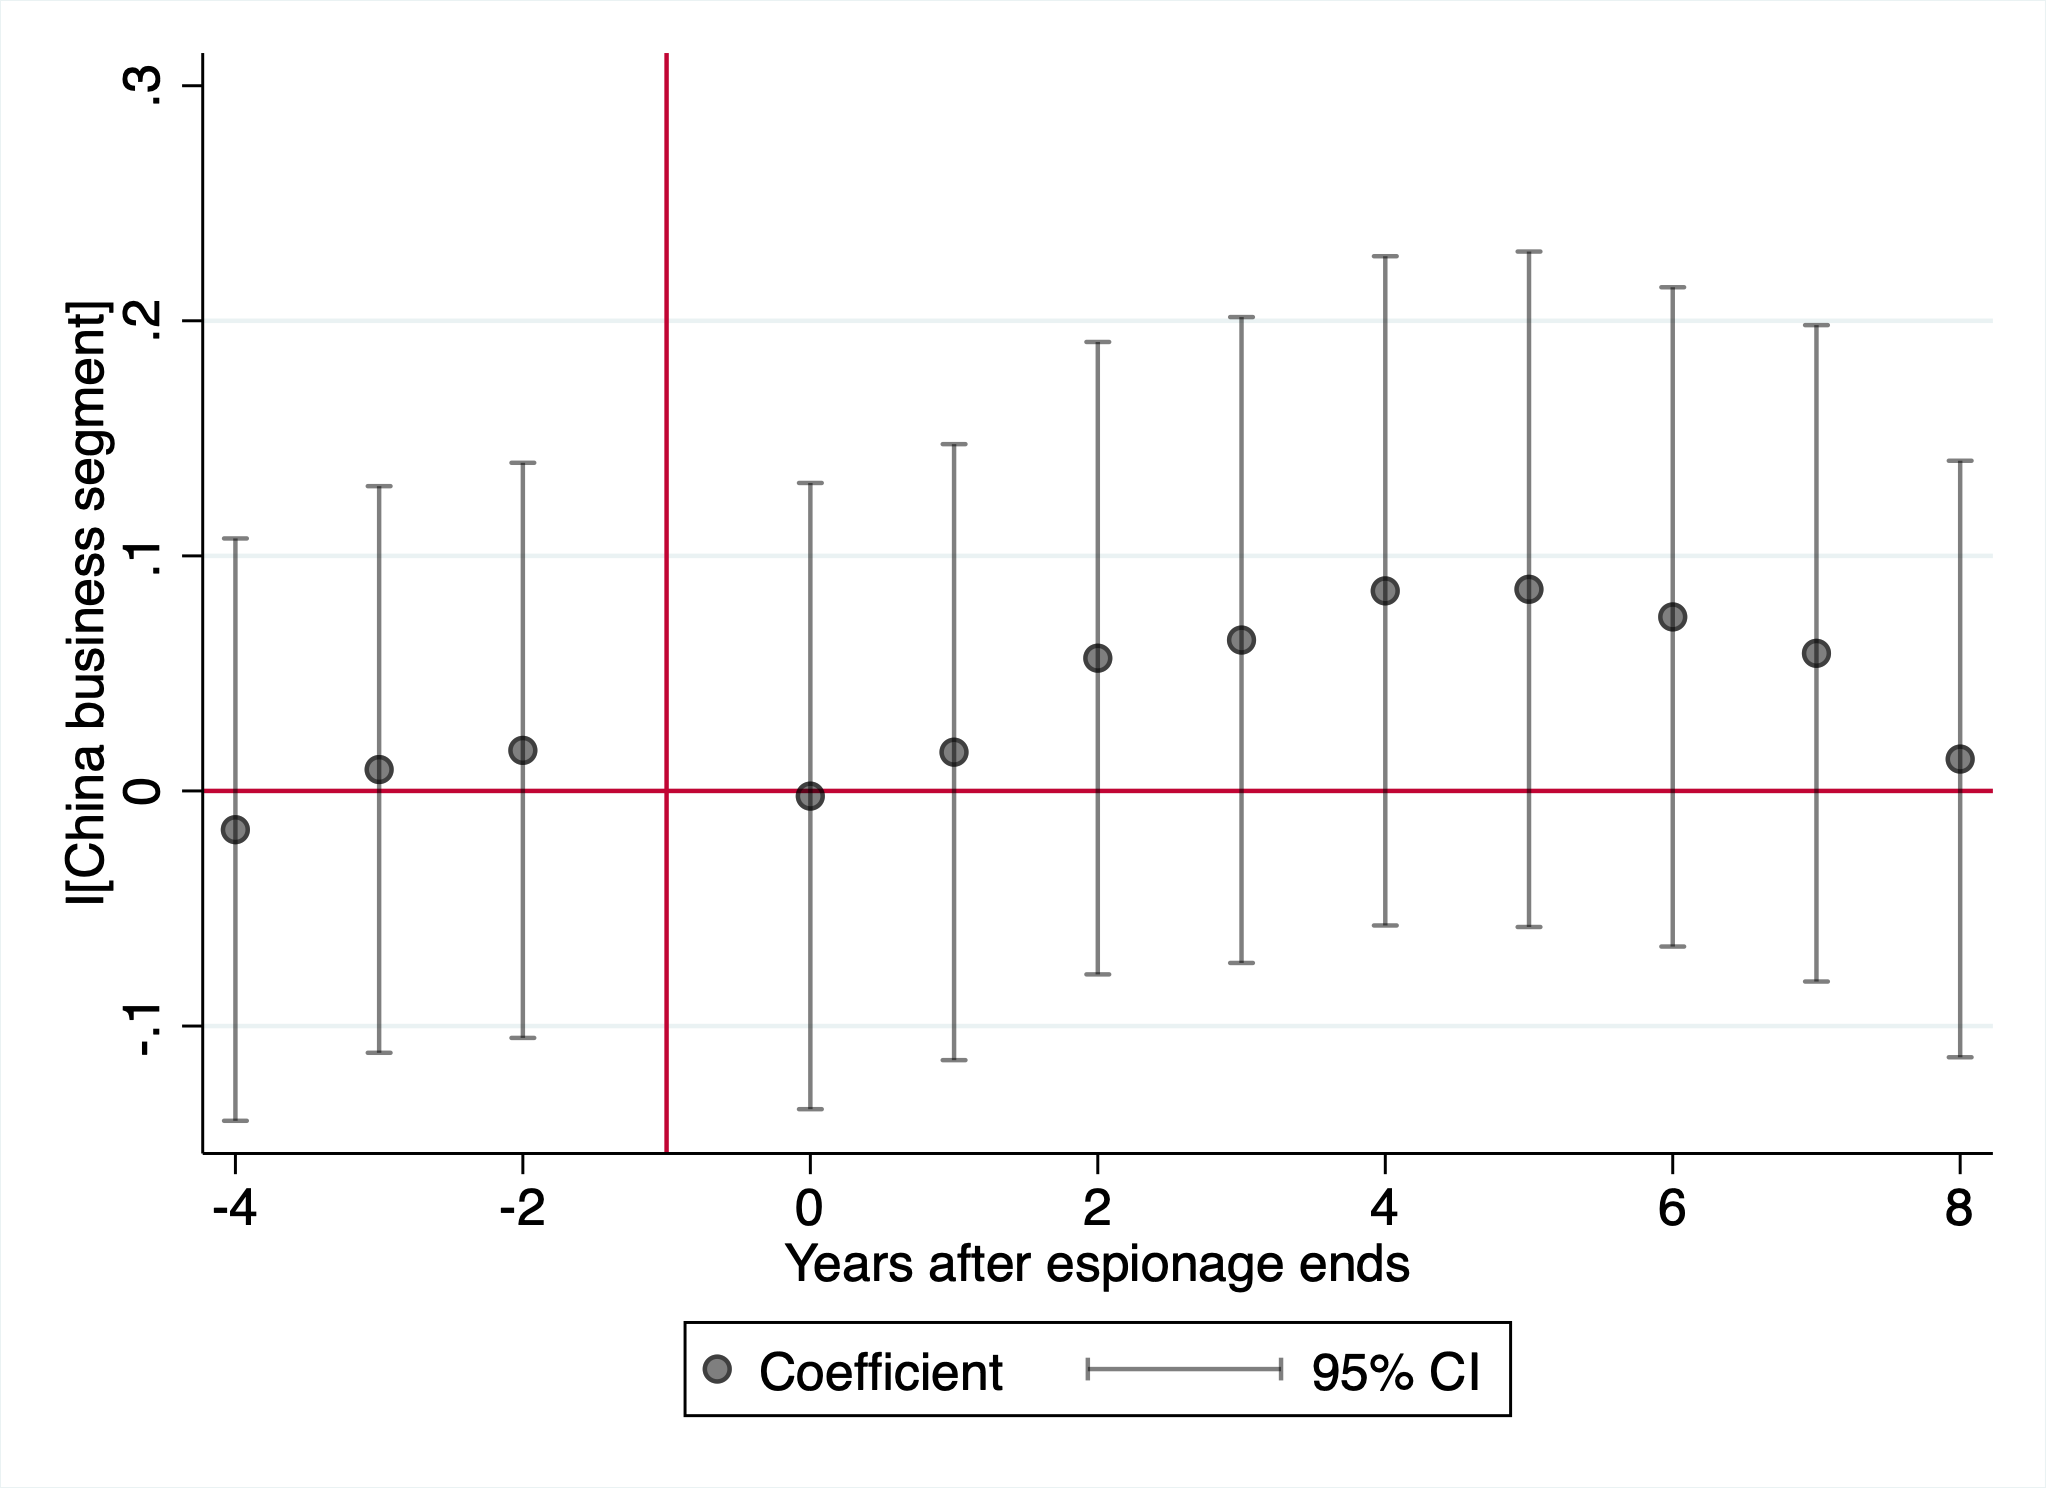
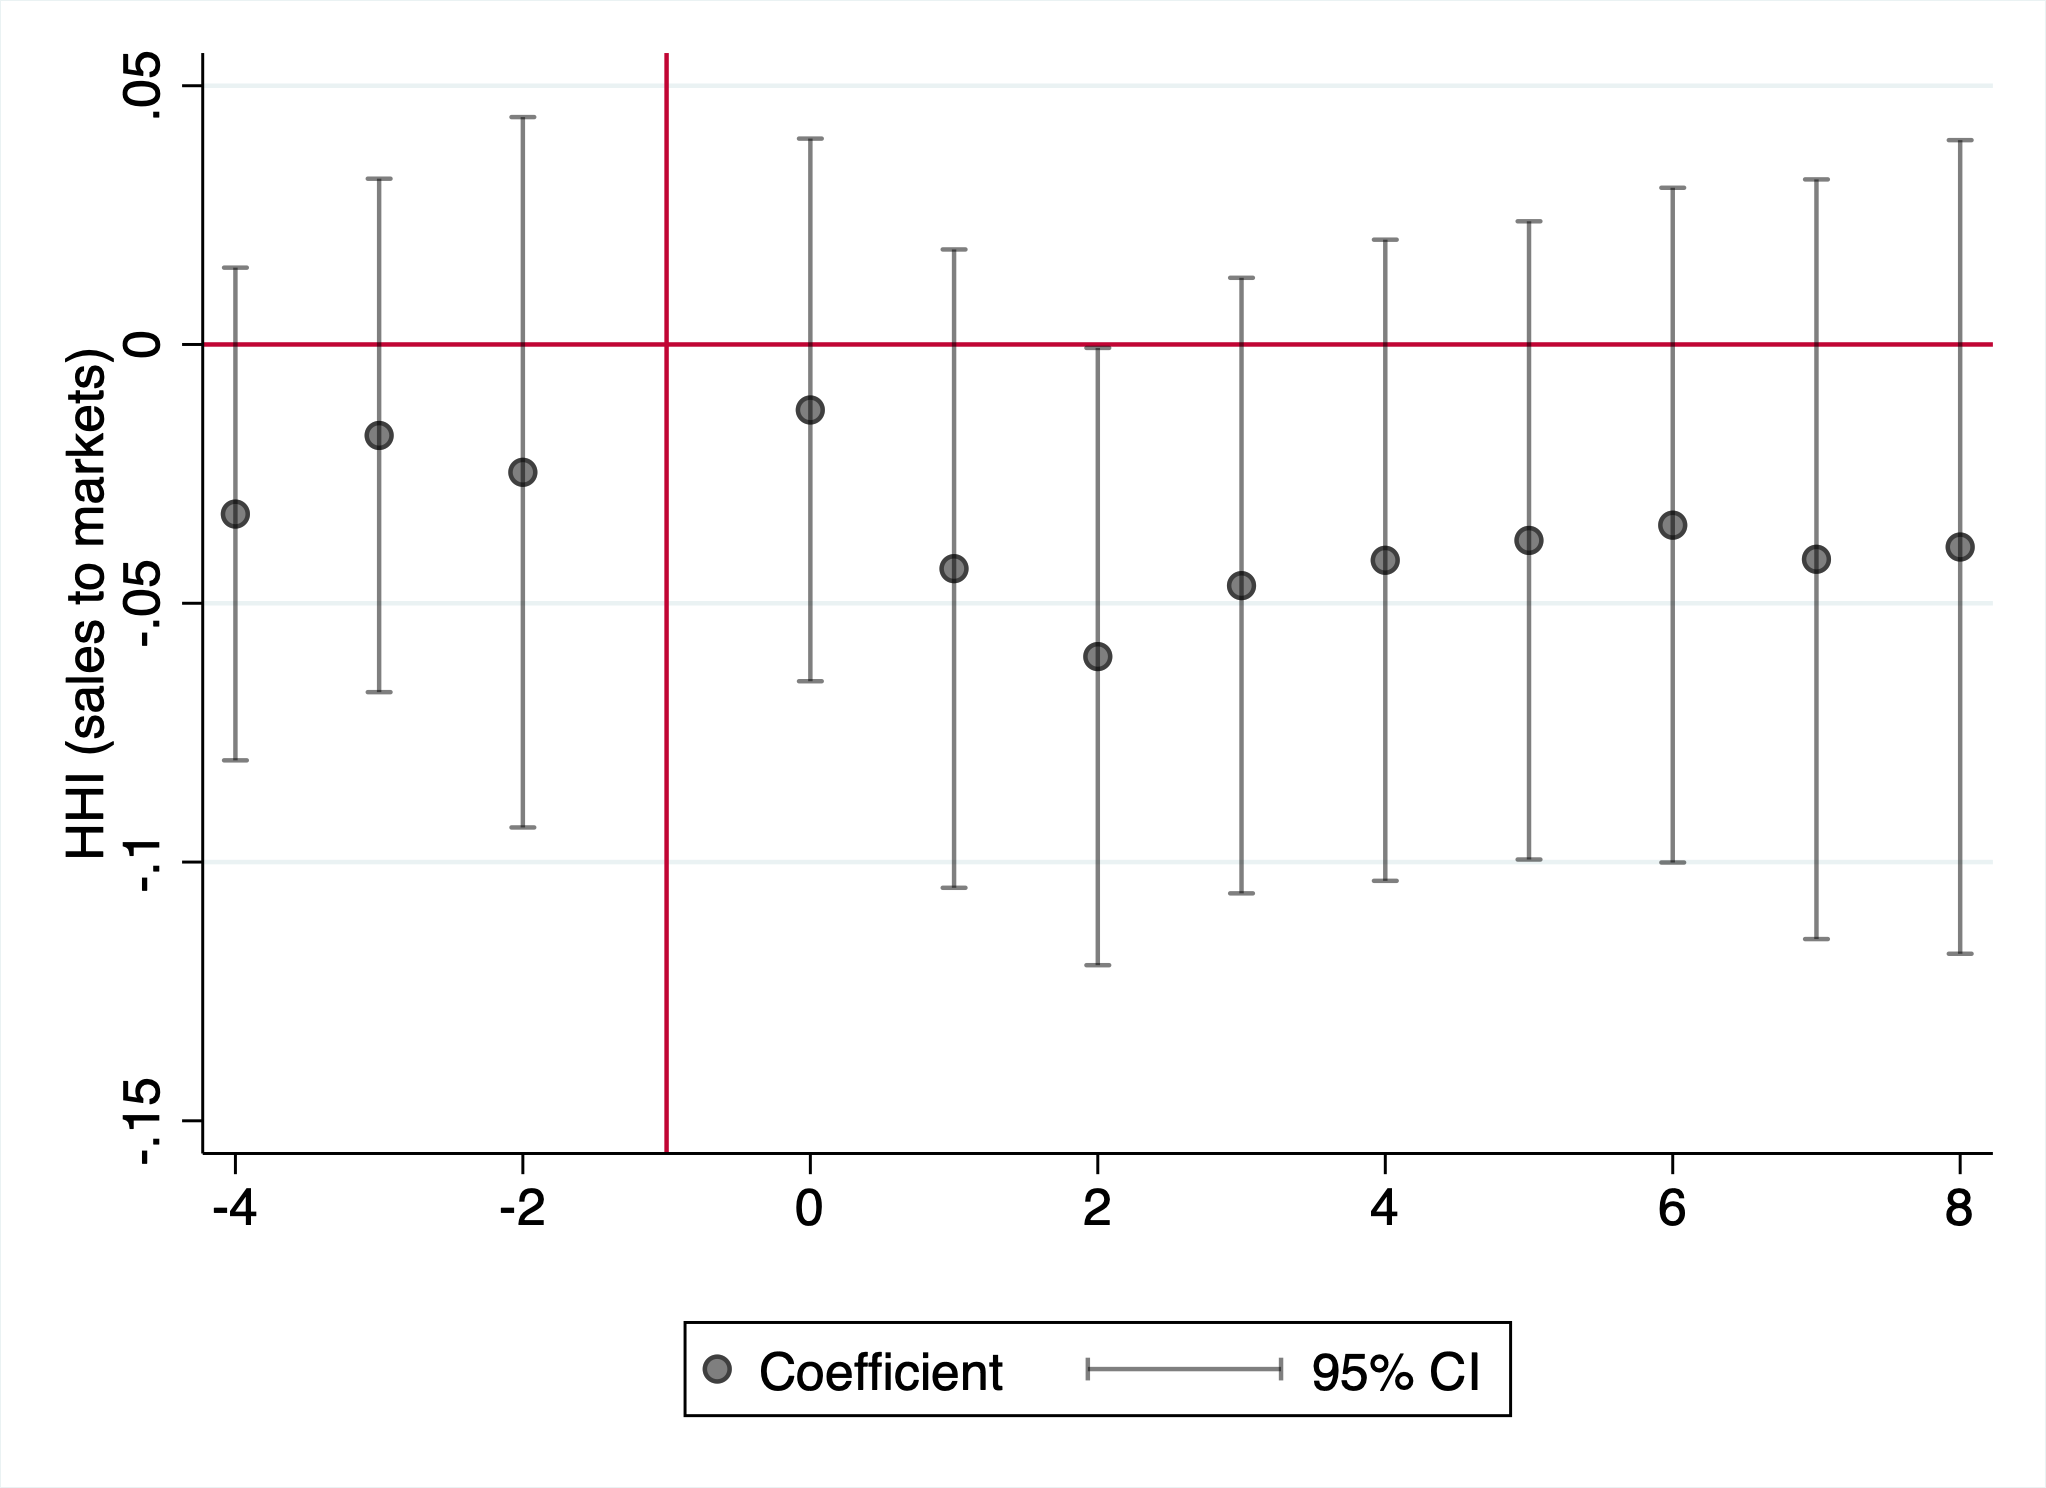
Panel C: log(Business segments) Panel D: HHI, sales across
bus. segments
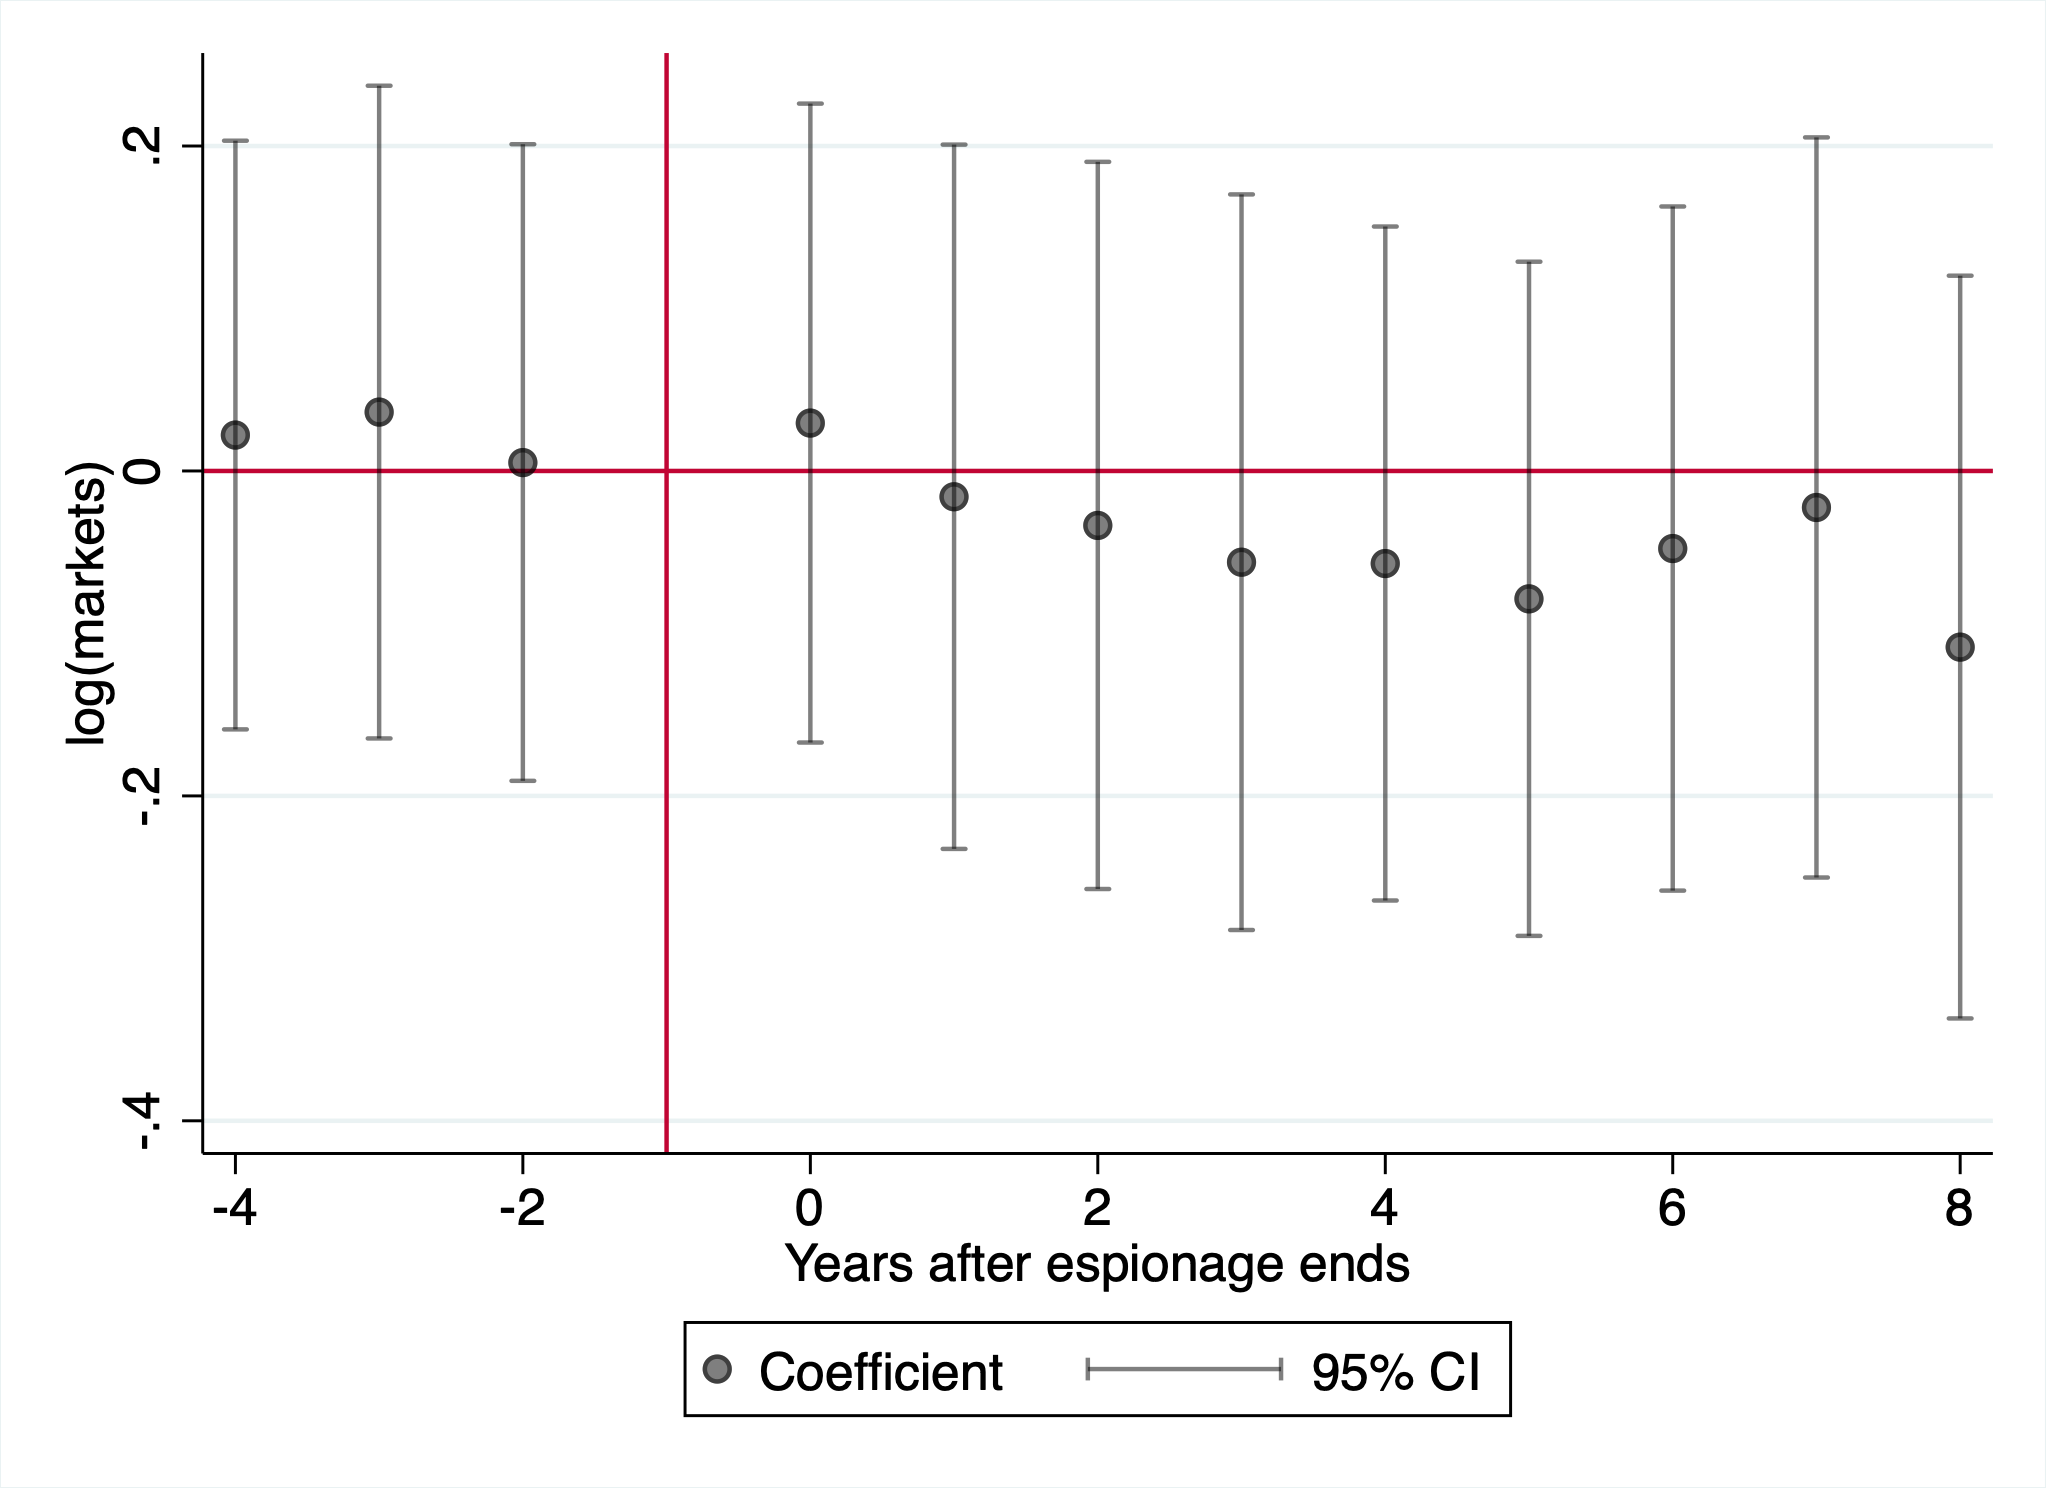
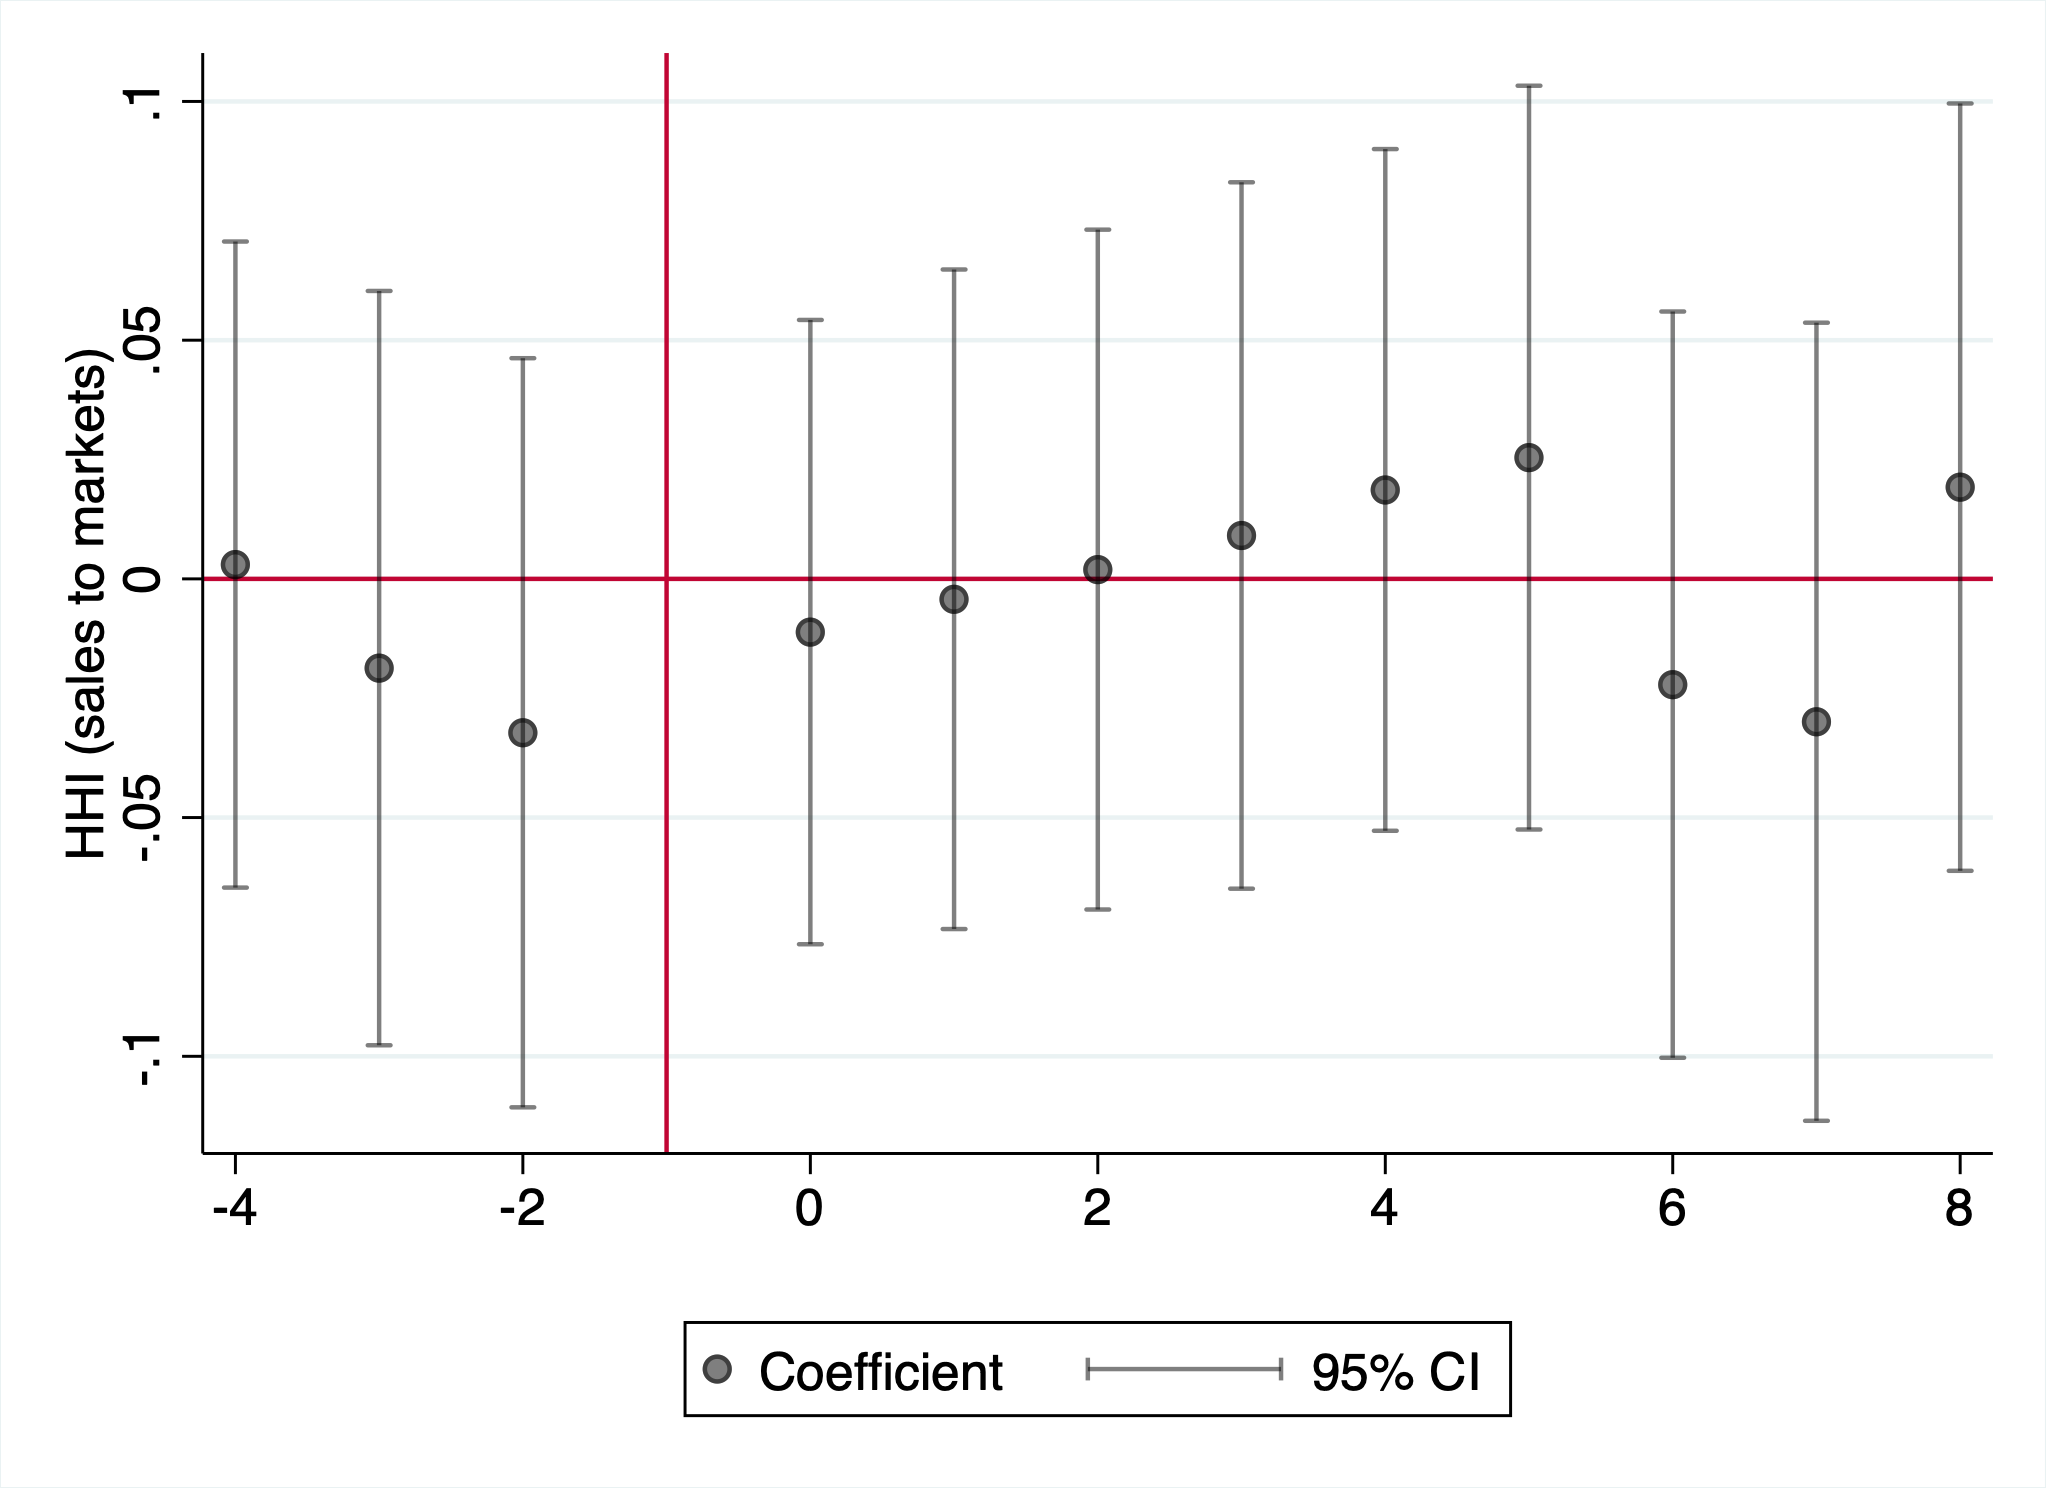
Note: This figure plots coefficients and 95% confidence intervals from two-way fixed effects regressions. An event is when an successful economic espionage incident ends. The outcome in Panel A is an indicator for whether the company operates a business segment in China, in Panel B the HHI of sales across geographic segments, in Panel C the log of the number of business segments the company reports being active in, and in Panel D the HHI of sales across business segments. Standard errors are clustered at the firm level.
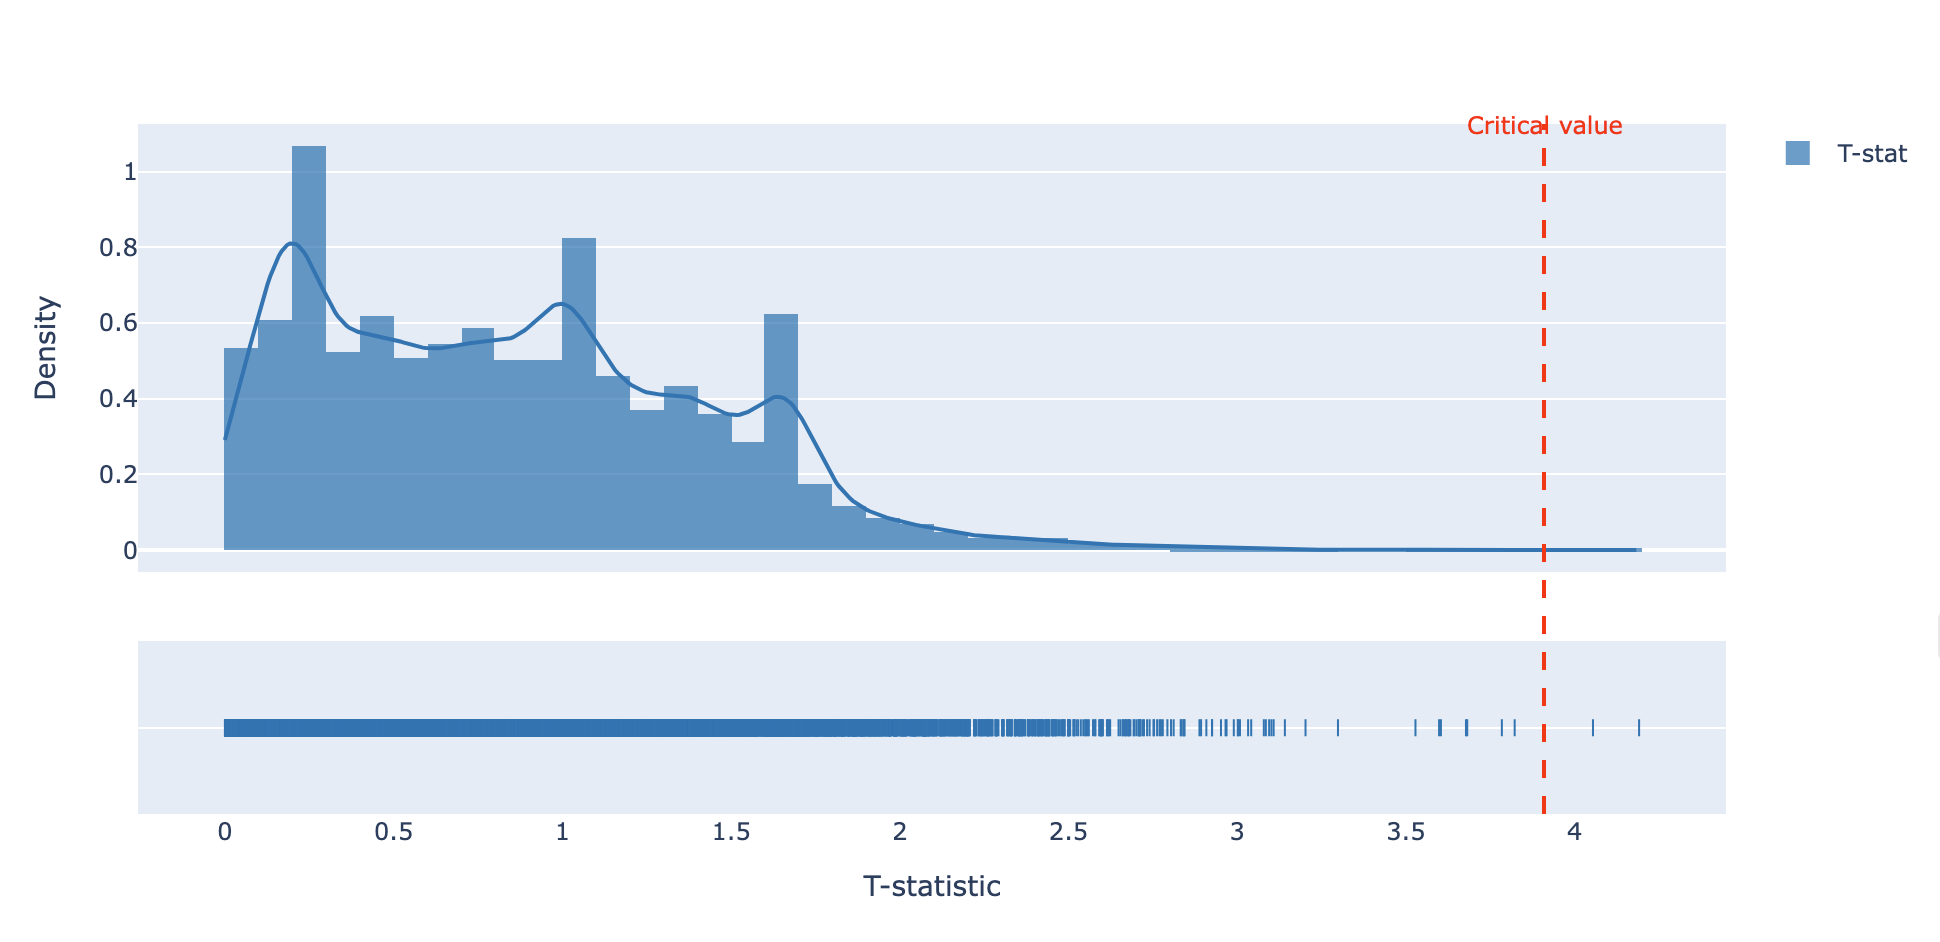
Note: This figure plots the distribution of \(T\)-statistics (as defined in 7.3) of difference-in-difference tests between successfully and unsucessfully targeted for espionage firms across 16,350 features of earnings calls. The critical value \((T=3.909)\) is displayed as a red dashed line. The two statistically significant features are ‘patterns of formatting changes or markup language’ (\(T=4.191\)) and ‘the word "while" in various contexts’ (\(T=4.054\)).
Panel A: Successful cases Panel B: Unsuccessful
cases
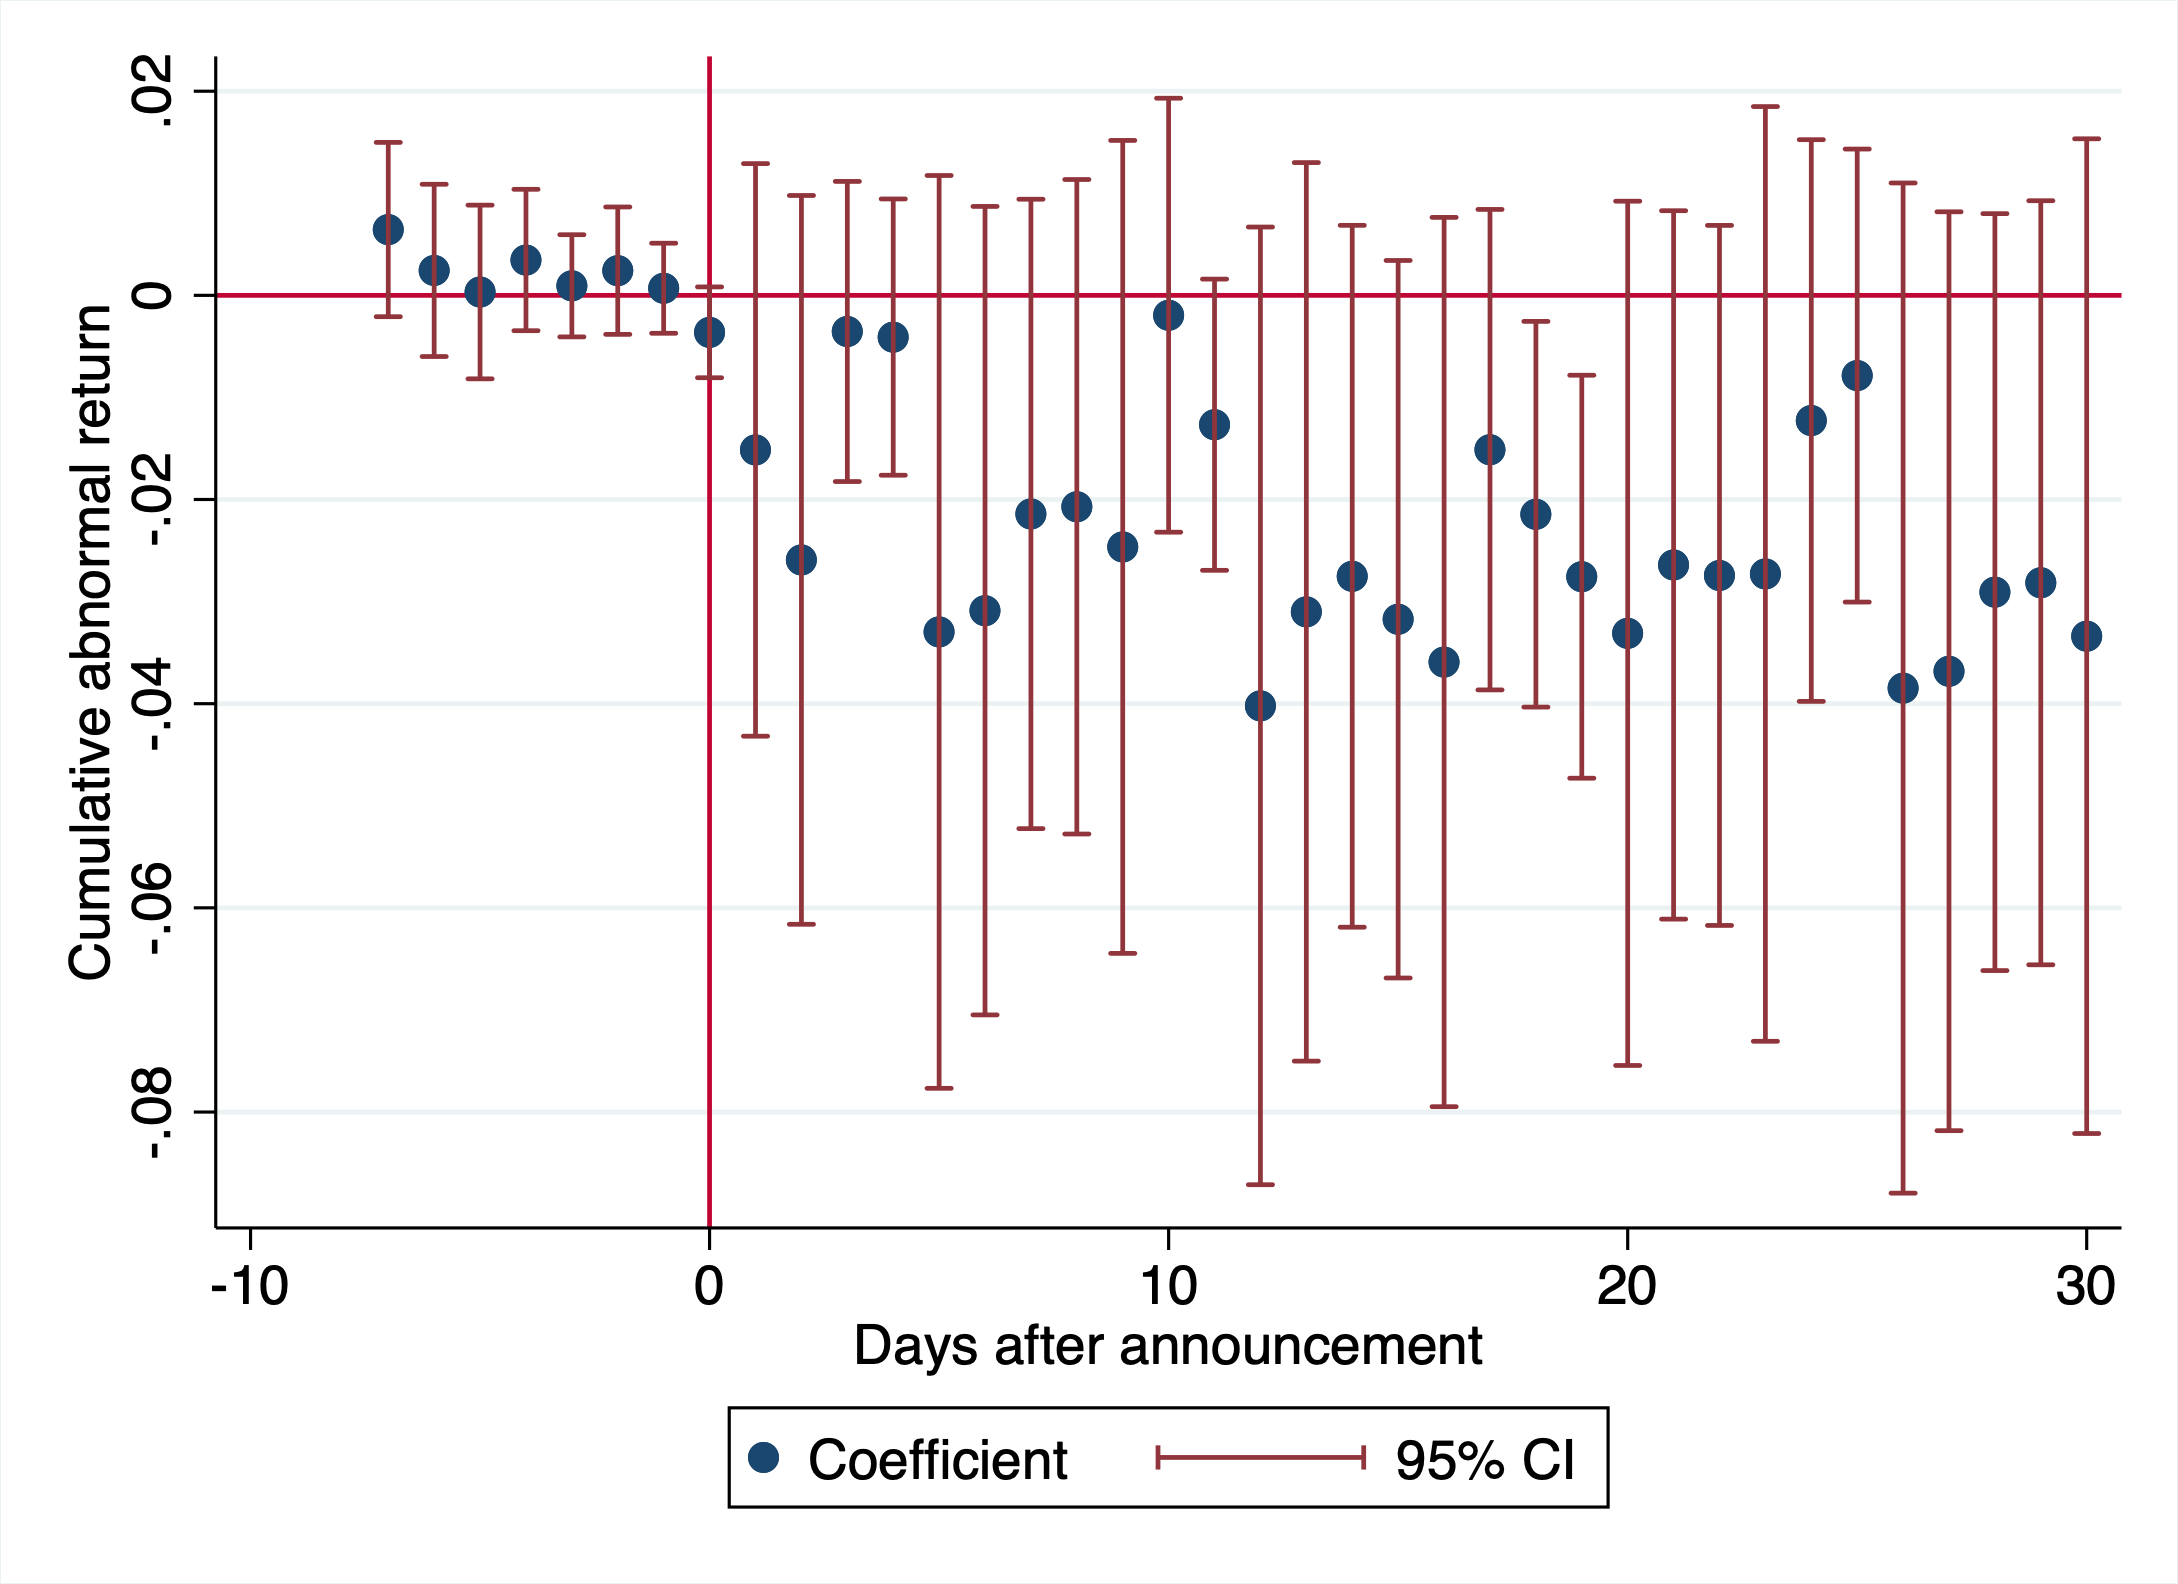
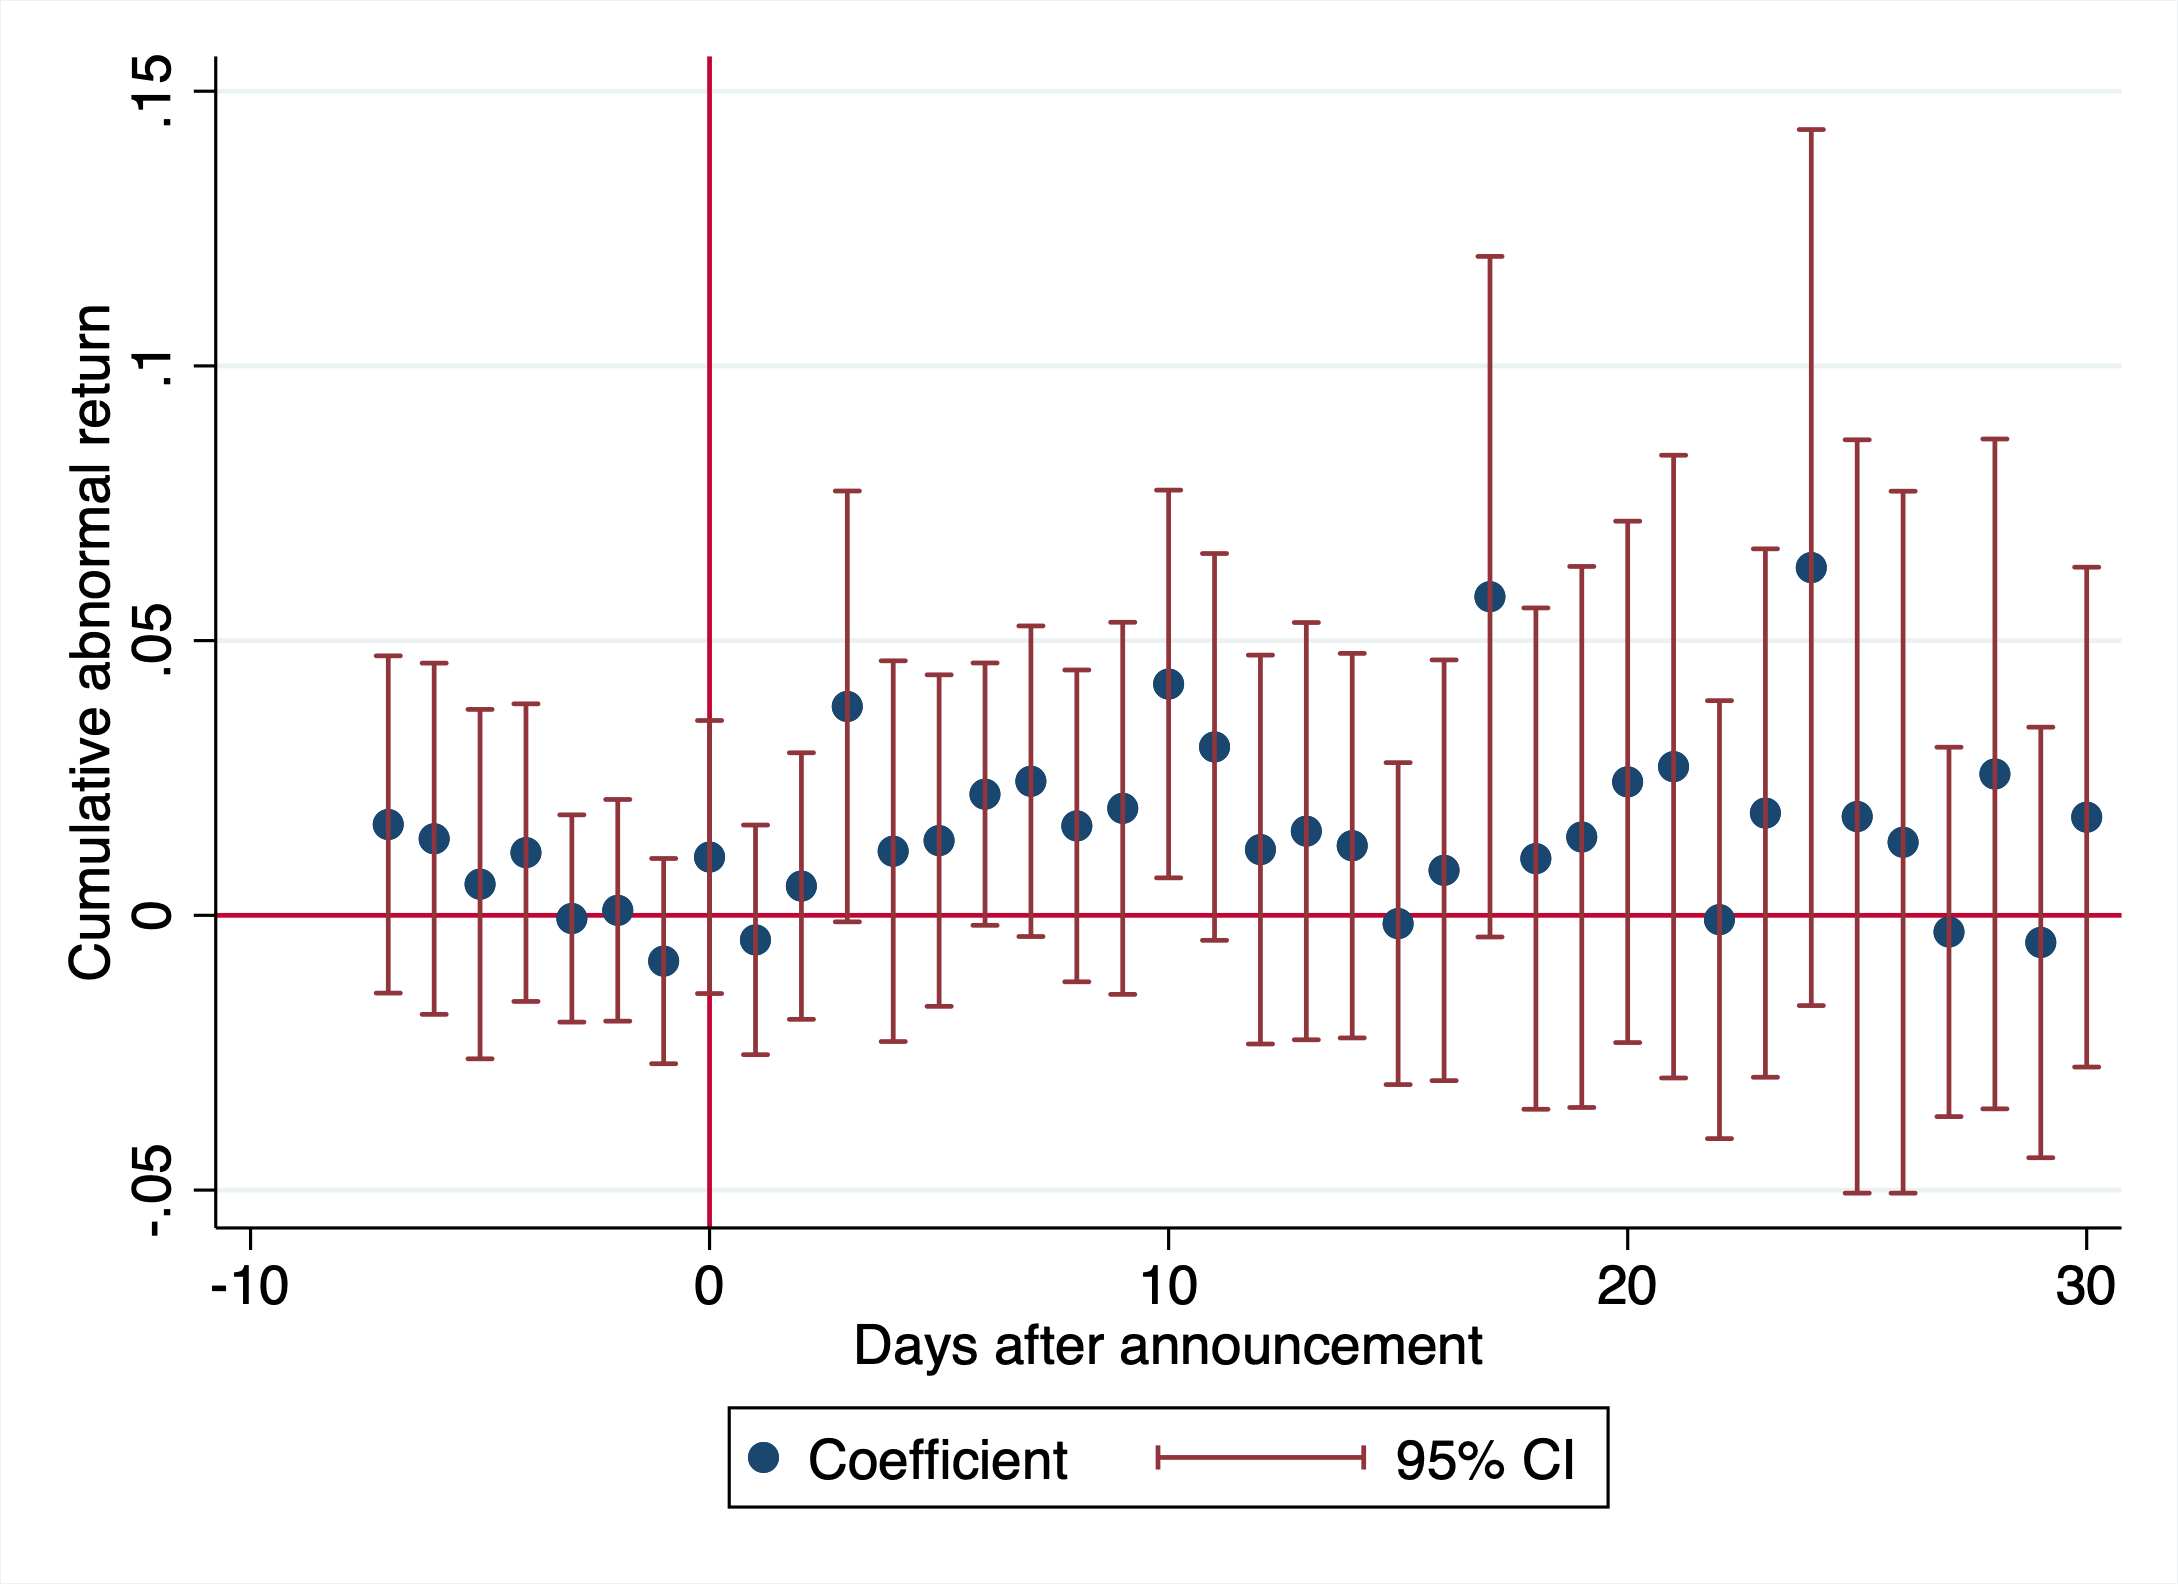
Note: This figure plots coefficients and 95% confidence intervals from regressions on victim firms of economic espionage at various time horizons. In Panel A, an event is the announcement of a firm being successfully targeted for economic espionage. In Panel B, events are unsuccessful cases of economic espionage, where the desired information was not successfully given to its intended recipient. Cumulative abnormal stock market returns are computed using Fama-French factors in the period 30 days before the announcement date. Standard errors are robust.
| Successful | Unsuccessful | Difference | |
|---|---|---|---|
| (1) | (2) | (3) | |
| log Revenue | 8.000 | 7.398 | 0.602 |
| (1.989) | (2.008) | (0.555) | |
| log R&D | 5.333 | 5.235 | 0.097 |
| (1.696) | (1.444) | (0.470) | |
| log Assets | 9.808 | 9.405 | 0.404 |
| (2.046) | (1.600) | (0.496) | |
| log Intangible Assets | 7.972 | 7.987 | -0.015 |
| (2.383) | (1.943) | (0.604) | |
| Gross margin | 40.921 | 51.831 | -10.910 |
| (19.771) | (30.706) | (7.338) | |
| Net profit margin | 7.955 | 8.991 | -1.036 |
| (16.368) | (24.178) | (4.486) |
Notes: Observations in this balance table are firm-years prior to an espionage incident. The sample is restricted to only firms ever targeted for espionage. Columns 1 and 2 of this balance table presents means and standard deviations for firms successfully and unsuccessfully targeted for espionage respectively. Column 3 presents the regression coefficient and standard error clustered at the firm level. * significant at 10% ** significant at 5% *** significant at 1%.
| Outcome: | I[Leader at \({t-X}\) is leader at \(t\)] | Dist. (1st - 2nd) | HHI | |||
|---|---|---|---|---|---|---|
| Leader = top | Leader = top 3 | |||||
| \(X=1\) | \(X=4\) | \(X=1\) | \(X=4\) | |||
| (1) | (2) | (3) | (4) | (5) | (6) | |
| Targeted SIC | 0.016 | -0.011 | -0.005 | -0.008 | -0.302 | -0.074 |
| (0.045) | (0.027) | (0.021) | (0.014) | (0.211) | (0.048) | |
| Constant | 0.837*** | 0.878*** | 0.905*** | 0.922*** | 1.247*** | 0.409*** |
| (0.026) | (0.015) | (0.013) | (0.008) | (0.137) | (0.030) | |
| N | 98 | 98 | 98 | 98 | 98 | 98 |
| Industry size | Yes | Yes | Yes | Yes | Yes | Yes |
Notes: This table presents coefficients and standard errors for regressions at the SIC level. The sample is restricted to SIC codes where an industry sharing an SIC 3 code was ever targeted for economic espionage. The independent variable of interest is whether an industry has been targeted by espionage. The outcome in columns 1-4 is the average probability of whether a leader in a given quarter \(t-X\) is still a leader in quarter \(t\). In columns 1 and 2, leader is defined as being the largest firm by revenue in industry, while in columns 3 and 4, leader is defined as being a top 3 firm by revenue. In columns 1 and 3, \(X=1\), while in columns 2 and 4, \(X=4\). The outcome in column 5 is the distance in log revenue between the largest and second largest firm. The outcome in column 6 is the average HHI within the industry. Industry size controls include (average) number of firms in industry, quarters of data available, and average log revenue. * significant at 10% ** significant at 5% *** significant at 1%.
Harvard University, Department of Economics, Cambridge, MA 02138, USA. andrewkao@g.harvard.edu↩︎
Center for the Governance of AI, London, N19JY, UK. karthik.tadepalli@governance.ai↩︎
See 7.3 for direct quotes by AMSC executives in the aftermath of the incident.↩︎
https://foreignpolicy.com/2012/07/09/nsa-chief-cybercrime-constitutes-the-greatest-transfer-of-wealth-in-history/↩︎
The prior literature studying the effect of such breaches (Gatzlaff and McCullough 2010; Arcuri et al. 2018) finds small, negative effects on targeted firms.↩︎
We search for references to the relevant legal statute, 18 U.S.C. § 1831 and 1832, as well as “economic espionage.” In three instances, we found a sealed search warrant and were unable to recover any further details regarding the incident.↩︎
There are roughly 50 of these websites in addition to www.justice.gov. We manually verify any economic espionage incidents in the roughly 3,000 webpages returned after a keyword search of ‘economic espionage’ across these websites.↩︎
This use of DOJ press releases combined with the CourtListener data supersets the data used by Fang and Li (2021) and Michaelides et al. (2026) to study Economic Espionage Act cases.↩︎
In particular, we search for news relating to “economic espionage” on Google News in one year time windows from 1990 to the present, we search the universe of US equity earnings call transcripts for “economic espionage”, and the websites of all cybersecurity firms mentioned or involved in the cases above (e.g., McAfee, Symantec, Mandiant, Crowdstrike, Kaspersky, etc).↩︎
This information was not always trivial to collect. Court filings often redact specific victims of espionage, necessitating the use of contextual information to identify the victim firm—for instance, finding the company that a suspect worked for during the espionage period on LinkedIn, cross-referenced against industry and geographical information made available. However, this is not always possible, leading to a number of cases in which we cannot identify a victim firm.↩︎
We further note that, insofar as there are cases that we do not observe, the total effect of economic espionage should be larger than that which we estimate.↩︎
This is an unfortunate limitation of the data that we cannot address, because Revelio does not provide names for us to do a more fine-grained classification ourselves. We acknowledge there is some risk of attenuation from misclassifying whether an employee is Chinese or a different Asian ethnicity.↩︎
We acknowledge that other interpretations are consistent with this pattern. Low-R&D industries may have less capacity to innovate around the stolen technology, or may be more mature with thinner margins, making competitive shocks more damaging. We view this heterogeneity as suggestive evidence and remain agnostic among these interpretations.↩︎
One caveat is that a stolen technology can allow Chinese firms to substitute previously imported inputs with domestic production, in which case the primary benefit would appear as higher domestic sales rather than higher exports. Our export-based measure captures only the internationally traded component of any benefit to China and may therefore understate China’s total gains from espionage.↩︎
We do not include HS6-year fixed effects, so as to be able to plot the event study coefficients for the rest of the world as a comparison point to the US and China coefficients. The US and China interaction coefficients are robust to the inclusion of HS6-year fixed effects.↩︎
Of the 129 Chinese incidents, 103 are successful and 26 are unsuccessful. One reason we may see similar estimates between the successful and unsuccessful incidents at the sectoral level is that there is some overlap in targeted industries. 33.6% of HS codes in the unsuccessful analysis are also present in the successful analysis.↩︎
One possible interpretation of the increase in patenting per R&D dollar spent is that as R&D spending declines, the firm cuts R&D lines with lower probability of success, leading to a higher patent output per R&D dollar. A related mechanical consideration is that patents reflect a pipeline typically lagged one to several years behind current R&D spending, so a sharp contemporaneous drop in R&D would reduce the denominator before it reduces the numerator. Both effects reinforce our substantive conclusion that the ratio increase does not reflect deliberate secrecy.↩︎
This is of course not a perfect proxy for the perceived espionage risk, as it covers many non-Chinese employees. It also does not differentiate between immigrants and native-born employees. Nonetheless, it is the best proxy we have, since we do not have the names of individuals in our data.↩︎
We note that extremely subtle, targeted discrimination—e.g., quietly not extending offers to new Chinese scientists without explicitly changing firm culture—might not be visible in employee reviews. Our DEI results are therefore most informative about overt or systematic changes in workplace inclusivity, and should be read as suggestive of a non-discriminatory response rather than conclusive.↩︎
The segments data is self-reported by companies: some companies provide breakdowns of sales by country, while others do so by broader geographic region (e.g., “Asia Pacific”). In our baseline analysis, we count the number of geographic categories that each company reports sales in. For China specific sales, we go through every geographic market description and manually classify them as operating in the Chinese market only if an explicit mention to China is made.↩︎
For example, Kopin Corporation reports segments including “Advanced Semiconductor Materials”, “Display Components”, “FDD”, “Industrial”, “Wafer Engineered Matls - R&D”.↩︎
Examples of hypotheses we can test for include both economically substantive ones (e.g., “references to scientific authors or collaborators, particularly in the context of publications or citations ”, “terms related to emergency medical services and their operations ”, “materials or methods related to chemical analysis and spectrometry”.) and stylistic ones (e.g., “numerical values related to sizes or dimensions”, “language constructs related to functions and their definitions in code ”).↩︎
We also note that for each of these mechanisms, there is a parallel plausible mechanism that would generate the opposite response, strengthening our preferred explanation of the result. For example, shareholders may demand changes in international business strategy in the wake of an espionage incident, personnel in charge of the relevant international operations may be scapegoated, firms may be pessimistic, etc.↩︎
We make use of all text fields available: the review summary, the review advice, the review pros, and the review cons.↩︎
A limitation of this imputation approach is that the relationship between review text and DEI ratings may not be stable over time. Language around diversity may have changed between 2008 and 2020, so models trained on post-2020 data may not accurately capture DEI sentiment in earlier reviews. We validate the imputation method by using it to predict overall ratings out-of-sample (for which ground truth exists back to 2008) and find strong performance, but this demonstrates temporal stability for a different outcome. We acknowledge this as a limitation of the imputed DEI ratings for 2008–2019.↩︎
We also set the warm-up ratio to 0.1 and use a weight decay parameter of 0.01.↩︎
This number was selected based on memory limitations from computing on an A100 GPU.↩︎
In particular, we use ‘gemma-scope-2b-pt-mlp‘, a 2 billion parameter model of Google’s Gemma LLM with SAEs trained on the MLP sublayer outputs. We make use of the SAE ‘layer-0/width-16k/canonical‘, which uses canonical SAEs that are expected to be most useful across a range of tasks.↩︎
In particular, we use the feature descriptions generated by GPT-4o-mini.↩︎
Ideally, we would aggregate revenue and R&D measures to the industry level and estimate an industry-level version of Equation 1 to directly test whether industry sales fell. Unfortunately, this aggregation is far too noisy to deliver informative results, so we can only make statements at the firm-level.↩︎
Specifically, we regress daily returns on Fama-French factors for the pre-period for victim firms to obtain a firm’s normal returns. We use these estimated coefficients to project normal returns and difference them from realized daily returns to obtain abnormal returns. We then sum over the days since the event occurred to obtain the cumulative abnormal return.↩︎
The median (mean) gap between an espionage incident beginning and the public announcement of an incident is 2.2 years (over 3 years).↩︎
Industry leadership is highly autocorrelated, and the average leader firm targeted by espionage has already been a leader for over 15 quarters by the time they are targeted.↩︎
The estimates for victims become much more imprecise because NAICS 6-digit codes are relatively small, but estimated magnitudes are consistent with our prior estimates.↩︎
One potential limitation is that our data only covers publicly known cases. If firms are aware of earlier espionage cases in their industry that are not made public, then they could be not responding to espionage simply because they are already aware of the risk. This is a possibility that we cannot rule out with our data.↩︎